"I'll tell you why I like the [nicotine] business. It costs a penny to make. Sell it for a dollar. It's addictive. And there's fantastic brand loyalty." – Warren Buffett (1987)
Swedish Match AB (“SWMA”) is a tobacco business that was founded by Ivar Kreuger in 1915. The company is unique because they are one of two publicly traded tobacco businesses dedicated to “a world without cigarettes” (the other being Turning Point Brands). The firm develops, manufactures, and sells quality products with leading brands in three primary product segments: (1) Smokeless, (2) Cigars, and (3) Lights. A $1 investment in SWMA at the IPO has grown to be ~$78.46 today (an ~18.99% TSR CAGR over the past 25.08 years). Assuming continued growth in its Smokeless and Cigars franchises, an investment in SWMA represents a compelling opportunity to invest in a vertically integrated, capital-light business that sells addictive/habitual use consumables with pricing power and an extremely long runway for growth ( ~0.2% of the TAM is penetrated). SWMA effectively combines the best qualities of Buffett & Munger’s KO thesis and Malone & Maffei’s CHTR thesis, but with lower capex requirements, better incremental returns, and faster growth.
Recommendation
Not investment advice. Please do your own due diligence. This report is meant for educational purposes only.
Brief Business Description
1. Smokeless – 64% of Sales & 71% of EBIT (Q1 2021):
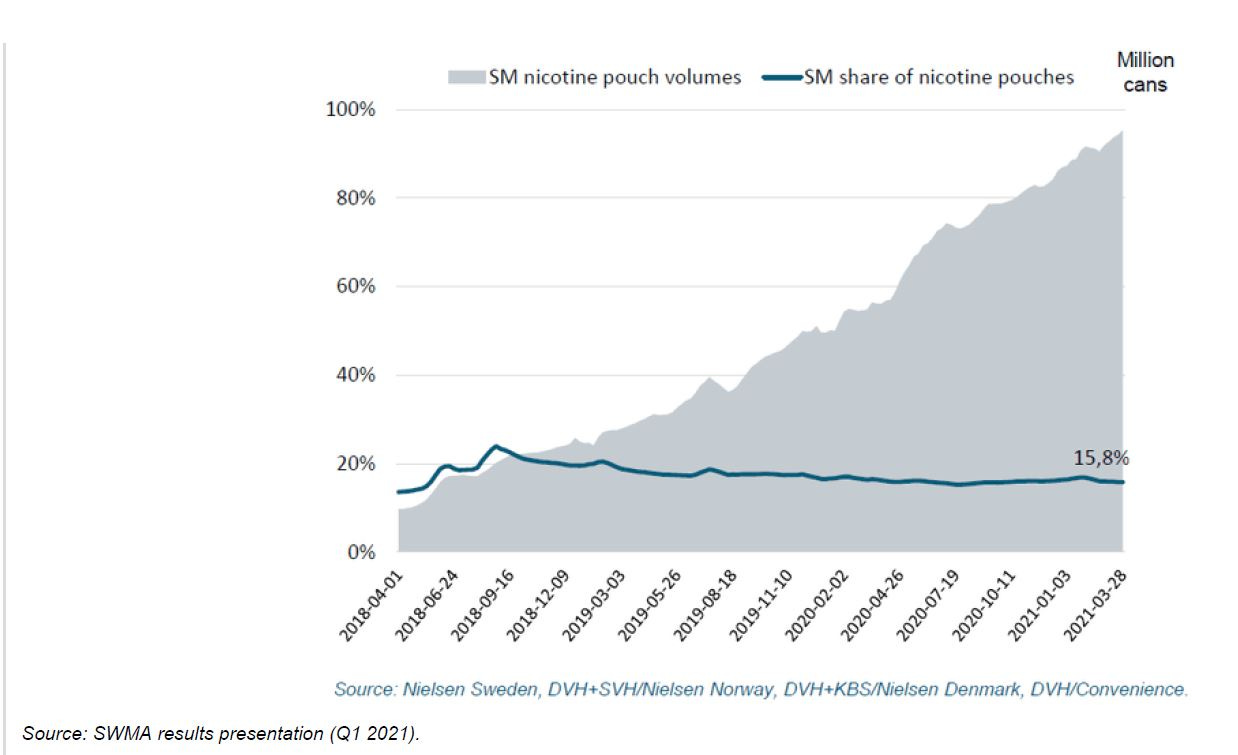
SWMA is the 3rd largest player and the 1st largest player in the oligopolistic US and Scandinavian Smokeless tobacco industries. The segment has experienced reinvigorated growth thanks to its reduced-risk product, Zyn, a nicotine pouch that has captured 70%+ of the dollar share of the category in the US. The segment is experiencing noticeable operating leverage, with incremental operating margins trending upwards over time.
2. Cigars – 29% of Sales & 28% of EBIT (Q1 2021):
SWMA is the 2nd largest player in the oligopolistic US cigars industry. The segment has experienced a secular demand lift associated with the legalization of cannabis in America and is also demonstrating noticeable operating leverage due to volume gains and pricing power. Incremental operating margins have also meaningfully inflected upwards over the past few years.
Investment Thesis
1. An emergent Moat: Zyn in the US
2. Strong incremental Returns on Capital: Zyn in the US
3. Long runway for growth: SWMA comprises less than 0.2% of total global tobacco spend
Risks - i.e., The Bear Case
- Regulation
- Competition
- Decreased Nicotine Consumption
- Shifting Profit Pools
Valuation
Industry Overview
SWMA operates three distinct business segments and, as such, faces a wide set of competitors. This report will only cover the Smokefree and Cigars segments in detail (~90.9% of total sales and ~99.2% of total operating profit - FY ‘20). We will begin by examining the industry value chain, later exploring the competitive landscape for SWMA’s Smokefree and Cigars segments. You can find a more detailed summary of the competitive overview in Appendix G: Competitive Overview.
Value Chain:
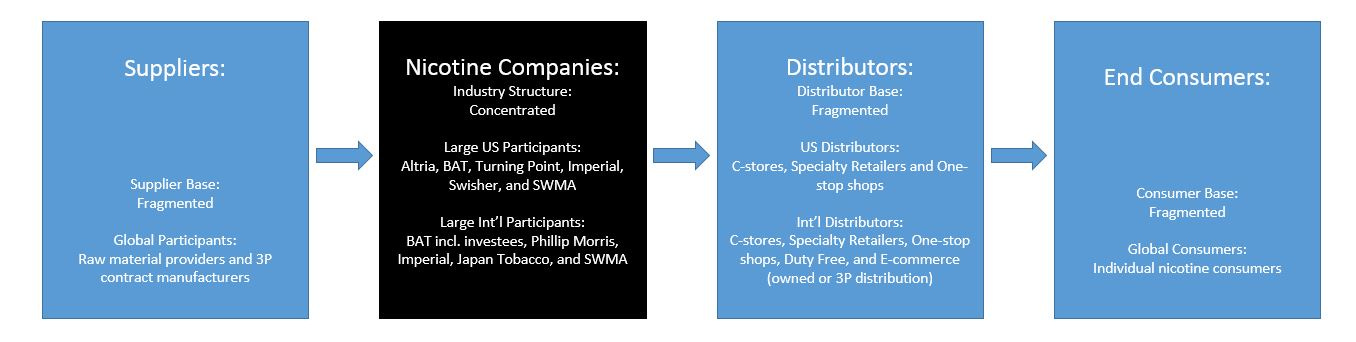
The Tobacco industry value chain is characterized by fragmented ecosystem constituents (suppliers, distributors, and consumers) and a very concentrated industry structure within its specific product categories. These dynamics, coupled with strong brand loyalty and the lack of compelling substitute products, mean that the tobacco companies exercise a great degree of power over both their suppliers and distribution channels. Suppliers to the industry are predominantly commodity providers characterized by perfect competition and very little bargaining power. Similarly, the distributor base also has fairly limited bargaining power. In the US, for example, while the c-store industry comprises 90% of cigarette sales and 97% of other tobacco products (“OTP”) sales, single-store operators comprise over 60% of the 155k c-store locations in the US.[1] The second-largest c-store operator in America, Couche-Tard (~5% share), can only command 14% and 29% gross margins on cigarettes and OTP, respectively. It follows then that the vast majority of the industry profit pool flows to the tobacco companies. The large US & Int’l tobacco companies listed above compete in a variety of product categories. Certain product categories will likely experience secular volume growth (cigars, e-vapor, heated tobacco, and nicotine pouches). In contrast, other product categories will likely experience secular volume declines (cigarettes, loose-leaf smoking tobacco, moist snuff, and chewing tobacco). Each product category at maturity will most likely be characterized by an oligopolistic industry structure and cooperative pricing amongst category participants (i.e., the industry typically raises prices 5%+ per annum). Consumers typically exhibit loyalty, and demand is inelastic/acyclical, aided by the addictive/habitual usage of nicotine products. The one exception to this persistent loyalty applies to category migration towards RRPs, from cigarettes and MST, which will be discussed later.
Again our focus in this report will be on the Smokeless and Cigars segments (~93% of sales and ~99% of EBIT - Q1 ‘21). A complete breakdown of SWMA’s business segments will be available in the appendices under Appendix D: Income Statement Breakdown.
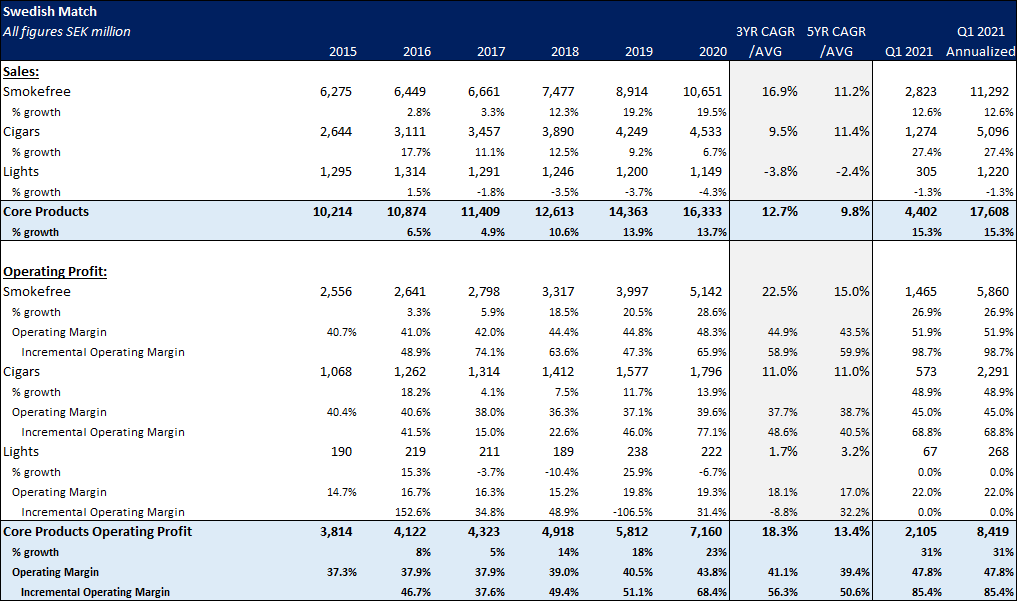
Smokeless – 64% of Sales & 71% of EBIT (Q1 2021):
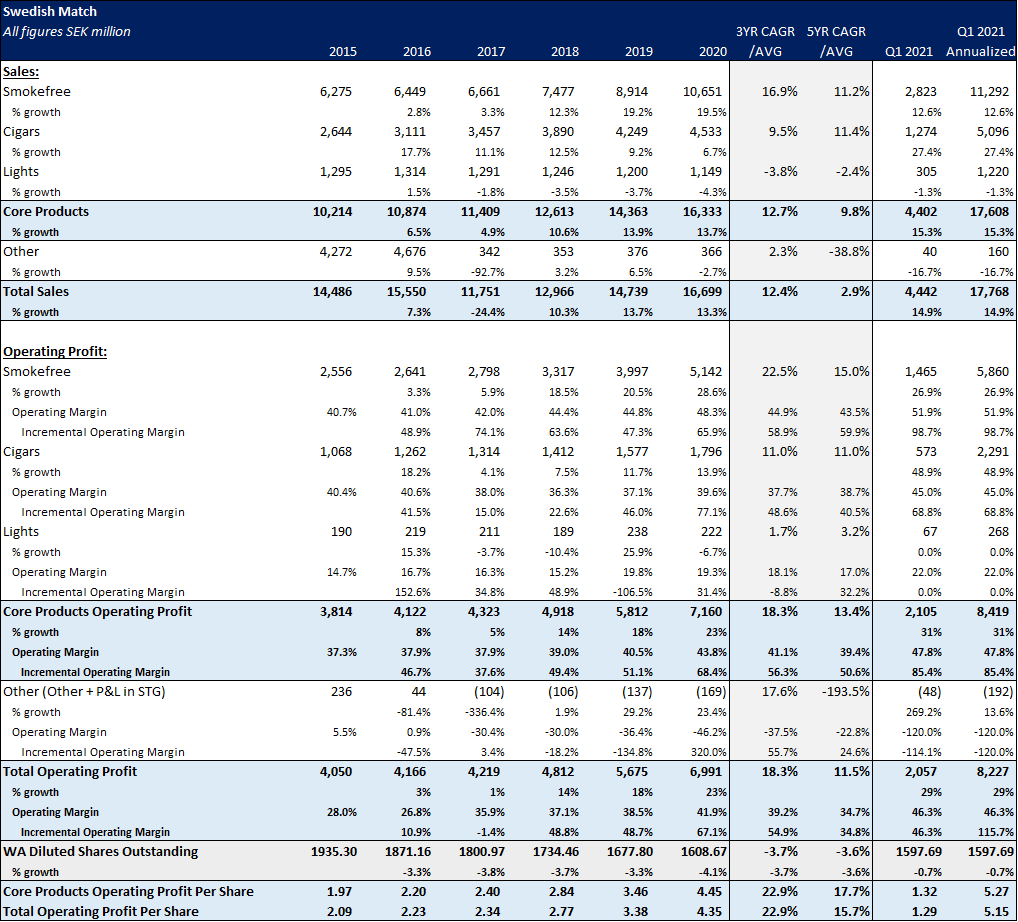
Smokeless is SWMA’s largest and most profitable business. The company participates in the Oral nicotine industry through participation in the US MST, Nicotine Pouch, Chewing Tobacco categories, and the Scandinavian Snus, Nicotine Pouch, and Chew Bags categories. Smokeless is a seasonal business, which is strongest in the summer months, so sales are typically highest in Q2 and Q3 in any given year. The segment has experienced an extreme amount of operating leverage, with operating margins as of FY2020 expanding 760 bps over those stated in FY 2015 (incremental operating margins averaged ~60% over this period). Even more impressive, in its latest quarter (Q1 2021), the firm managed to deliver an operating margin expansion of 360 bps over FY2020 (incremental operating margins of ~99% vs. Q1 2020). This operating leverage can be directly attributed to cost control, scale economies (i.e., experience curves) & pricing power and helps underscore the business segment's scalability/attractiveness overall.
The primary distribution channel is c-store retailers who choose to sell SWMA’s Smokeless products because they are addictive habitual use products that regularly bring consumers in the door, produce greater GP dollars & GM on a per unit basis, and create higher-margin cross-selling opportunities. On the other hand, consumers select Smokeless products based on some combination of price relative to alternatives, brand affiliation/social proof, convenience, and perceived product quality/benefits. Of all these factors, convenience is probably the most important. Consumers are lazy and are very unlikely to go out of their way to seek out a product. Hence, store penetration is probably the most crucial contributor to success (i.e., the best ability is availability).
More on Zyn later.
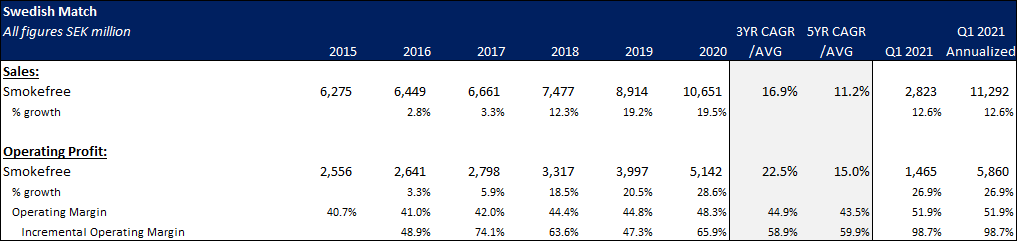
Cigars – 29% of Sales and 28% of EBIT (Q1 2021):
Cigars are likely SWMA’s strongest business from a competitive standpoint and its secondary engine for growth. The segment participates in the US Cigars industry through its participation in the HTL and Natural Leaf Cigars categories. Cigars are also a seasonal business, which is strongest in the summer months, so sales are typically highest in Q2 and Q3 in any given year. The past 3 quarters have seen Cigars volumes increase 20% YoY, which we believe to be a secular demand change brought on by Marijuana legalization (i.e., for use in blunts). This mirrors the similar volume increases seen in Turning Point Brand’s Zig-Zag segment over the same period. In the most recent quarter (Q1 2021), cigars revenue at SWMA increased 27% due to a combination of 21% volume growth and a 6% price increase YoY. This revenue growth came with near 69% incremental operating margins (vs. Q1 2020) and led to a margin expansion of 540 bps vs. FY2020. This new secular demand engine could result in persistently higher incremental margins for the segment (as demonstrated in FY2020 and Q1 2021) and higher growth moving forward, making the Cigars business a far more attractive and scalable business than we had initially thought.
Like the Smokeless business, the primary distribution channel is c-store retailers who choose to sell SWMA’s Cigars products because they are addictive habitual-use products that regularly bring consumers in the door and create higher-margin cross-selling opportunities. On the other hand, consumers select Cigars products based on some combination of price relative to alternatives, brand affiliation/social proof, convenience, and perceived product quality/benefits. Of all these factors, convenience is probably the most important. Consumers are lazy and are very unlikely to go out of their way to seek out a product. Hence, store penetration is probably the most crucial contributor to success (i.e., the best ability is availability).
Why Distribution Channels will Choose RRP’s like Zyn – The Arkansas and New York Examples
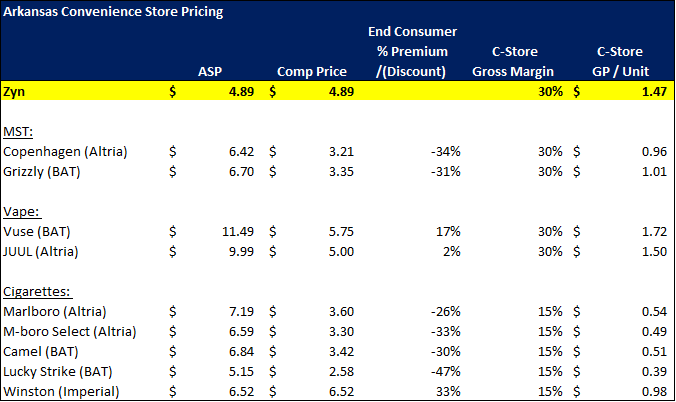
C-stores will make more money on a per-unit basis selling RRPs than traditional tobacco products and thus will be incentivized to push these RRPs through better store placements (i.e., high-value shelf space). Each customer that a c-store nudges from cigarettes or MST to vaping or nicotine pouches will improve their asset turns (i.e., revenue / total assets), gross profit yield (gross profits / total assets), and marginal economics as the typical c-store operator has some fixed costs in the form of rent. Below are two examples: Arkansas and NYC.
Arkansas:
NYC:
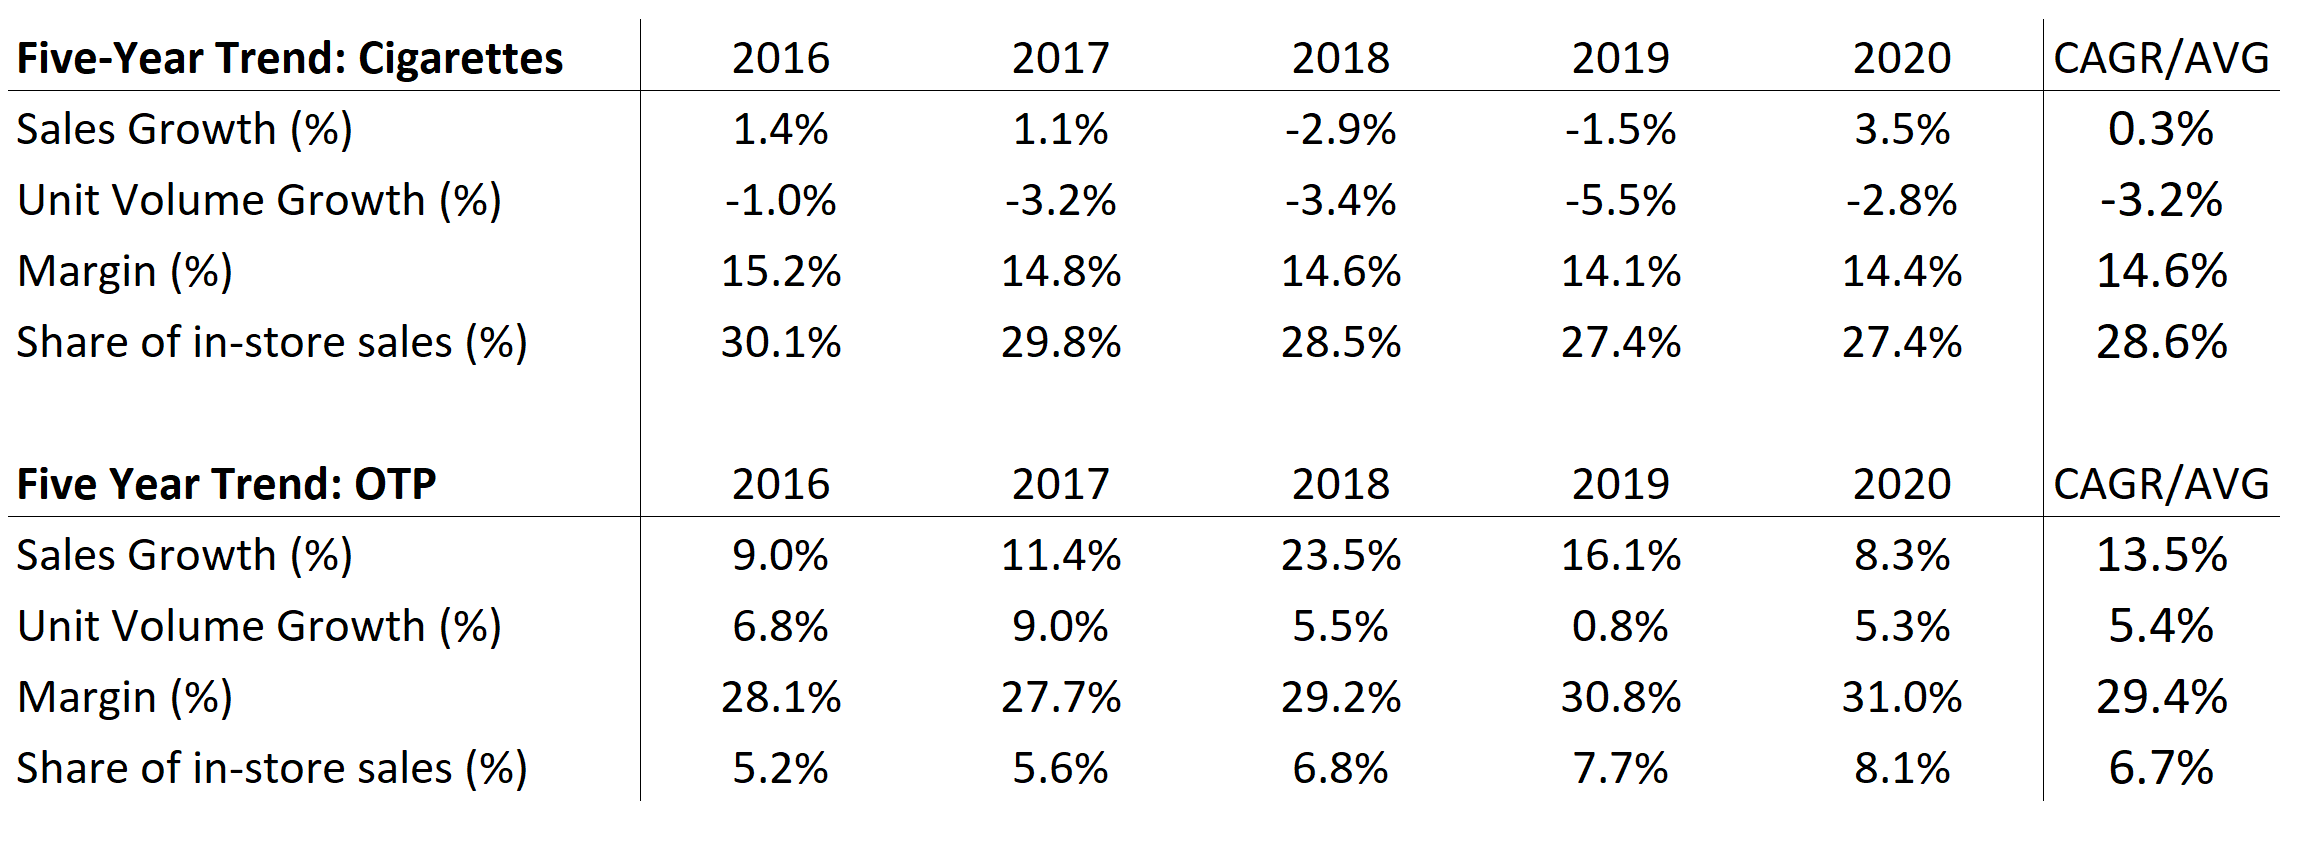
Thank you to @RetaOx (Arkansas) and @ NYC_Hobbes (NYC) for the great visuals. We’ve assumed the Arkansas operator has similar gross margins to that of Couche-Tard, who typically earns gross margins of 29% on other tobacco products (“OTPs) and 14% on cigarettes. From the Arkansas example above, the incentives are clear. This operator can nearly 3x their GP per unit sold by nudging consumers from cigarettes to Zyn or nearly 1.5x their GP per unit sold by nudging a consumer from MST to Zyn.The data clearly supports this notion, as there is a clear mix shift occurring in the c-store channel away from cigarettes and towards OTP over the past 5 years[2]. Our next example, New York, supports the notion that Zyn is a priority for c-store’s. The products are given prime shelf space typically reserved for bestsellers.
However, to temper the enthusiasm on Zyn, it is important to note that BAT and Altria comprise the lion’s share of a given c-stores total gross profit dollars in the tobacco category and thus also maintain powerful relationships with distributors. It is still early days in the category, and although early data for Zyn has been promising, c-stores will always prioritize the suppliers that earn them the most money (i.e., “Whose bread I eat, whose song I sing.”).
Why Customers and Companies will Choose RRP’s like Zyn:
Traditional tobacco products and traditional cessation methods have demonstrable user experience (“UX”) problems.
UX Problems:
Traditional tobacco products kill you and increase your probability of disease – The average cigarette smoker dies 10-years earlier than the non-smoker[3]. The average cigarette user is more likely to develop lung cancer, heart disease, etc., than the non-smoker. The average oral tobacco user is more likely to develop oral cancer than the person who abstains from oral tobacco usage. Tobacco companies effectively kill their best customers (i.e., truncating customer life and lowering CLTV).
Traditional tobacco usage increases health insurance premiums – In nations with private healthcare, tobacco usage can dramatically increase health insurance premiums. For example, US health insurers can boost a tobacco user’s premiums by approximately 50% by invoking the Tobacco Rating.
Traditional tobacco products are not hygienic – MST (“dip”) is incredibly messy to use and produces dip spit that requires a “spitter.” Dip is a predominantly male category and does not play well with the other sex. Oftentimes, one’s significant other will require the dip user to brush their teeth before getting intimate (so they do not taste dip spit which can cause the opposite sex to vomit). Likewise, cigarettes present their own hygiene issues. Cigarettes leave a highly recognizable scent on one’s clothes and breath after usage. Cigarettes, Snus, and dip all produce noticeable stains on the teeth of chronic users. This combination of factors has contributed to the lack of female participation in traditional oral tobacco categories.
A conversation with @willgriffith16 who now uses Zyn
Traditional tobacco products do not allow for discrete usage – Tobacco usage is often accompanied by social stigma, and the inability to conceal usage can have meaningful social and professional ramifications. This can manifest in family interventions for consumers living at home because your mother discovered a lighter or that your clothes smelt like cigarettes. In a professional workplace, smelling like cigarettes or having cigarette breath can reflect poorly with superiors and/or customers. Dipping in the professional workplace is definitely a serious no-no. Additionally, the inability for discrete usage means that users must expend substantial energy to conceal their traditional tobacco usage (i.e., smoke outside or vape in the wheelchair stall).
Traditional tobacco cessation methods do not satisfy cravings – Traditional cessation methods like nicotine gums, patches, or sprays lack speed & scale of nicotine delivery, nicotine potency, the similarity of ritual/experience, and leave users unsatisfied.
RRPs, alternatively known as “new categories,” solve many of these UX problems listed above. Unlike e-vapor or heated tobacco (“HTU”), nicotine pouches (like Zyn) specifically solve each of our listed user experience problems – except speed & scale of nicotine delivery (relative to vapes and HTU) – and come at a lower all-in cost than other RRPs due to the lack of initial device purchase associated with vapes and HTU. Nicotine pouches don’t kill you, or increase your probability of disease, or cause your health premiums to rise. Furthermore, nicotine pouches have a great flavor profile, are incredibly hygienic (i.e., they don’t produce dip spit or stain teeth), and allow for discrete consumption in a professional workplace. Most importantly, pouches are incredibly effective at satisfying nicotine cravings relative to traditional cessation methods. Nicotine pouches are so effective at solving the UX problems of traditional tobacco users that they’ve succeeded in attracting female consumers to the male-dominated oral arena. In fact, SWMA claims ~50% of Swedish nicotine pouch buyers are women. This phenomenon is not unique to Sweden. In America, Turning Point Brands’ recent 1000 store test run for its extra-strength nicotine pouch “Fre” demonstrated that ~20% of “Fre” purchasers were women. At a more normal 6mg nicotine level (vs. 12mg for “Fre”), we would assert that US female participation would likely trend closer to that of Sweden.
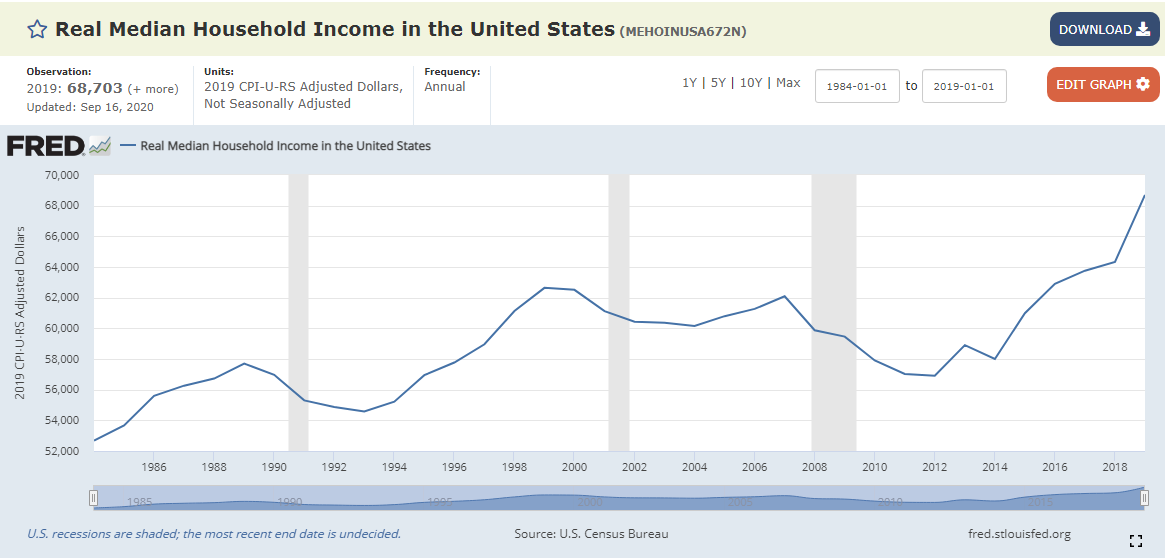
1. Health of the Economy & Median Household Income
The health of the US & Scandinavian economies will directly impact both wages and employment in the regions. Wages and employment are two of many components that comprise household income. Higher household income contributes to higher discretionary income that can be spent on items like Cigars, MST, Snus, or Nicotine Pouches. Annual nicotine pouch spend as a % of household income will be an important KPI to track as it provides valuable information concerning the pricing power of SWMA’s products. Assuming the average consumer purchases 3 tins a week at SWMA’s US ASP of $4.95, the annual pouch spend would be ~$772.20. This would be ~1% of 2019 US median household income and ~2% of 2019 US median income. It is also important to note that the US monthly child benefit of $300 would increase the purchasing power of a family with children in nominal terms and provide added cushion for future price increases in addictive consumables like Zyn.
2. Distribution
The number of distribution outlets increases the product's availability, and the allocation of priority shelf space within those outlets contributes to greater sales velocity (i.e., sales per store per week). These factors contribute to product sales and thus volume share. Without distribution and volumes, Zyn can neither turn its social proof flywheel nor build addictive/habitual customer relationships.
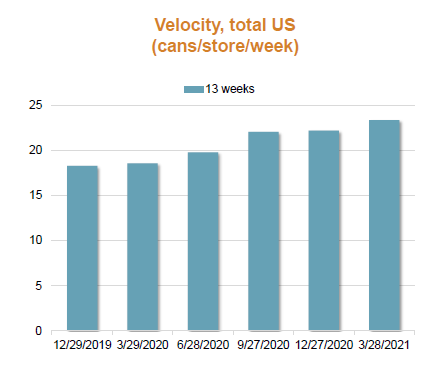
3. Sales Velocity – Cans/Store/Week
Sales velocity informs us of the rate of change of Zyn volumes on a per-store basis and provides a helpful tool in assessing whether volumes are trending in the right direction.
4. Retail Dollar Share
Retail dollar share should inform us of any material changes in consumers’ willingness to pay and will alert us to weakness in Zyn’s competitive position.
Investment Theses:
SWMA is a capital-light compounder that sells an addictive habitual use product with phenomenal brand loyalty, pricing power, insane incremental returns on capital, and a long runway for growth. The alternatives to SWMA’s products (traditional tobacco) kill you or have glaring user experience problems, so it’s a win-win for the consumers and the companies. In a nutshell, this is a better adaptation of Buffett and Munger’s investment in Coca-Cola that also incorporates elements of Charter’s levered capital returns.
1. Emergent Moat: Zyn (US)
In the interest of brevity, our discussions of the US cigars and Scandinavian snus business will be brief. Each possesses a strong legacy moat comprised of a brand, operant conditioning/habitual use, regulation, scale, and distribution (i.e., the standard tobacco legacy moat). We will focus more on the emergent moat of Zyn in the US only (not Scandinavia) for our discussion.
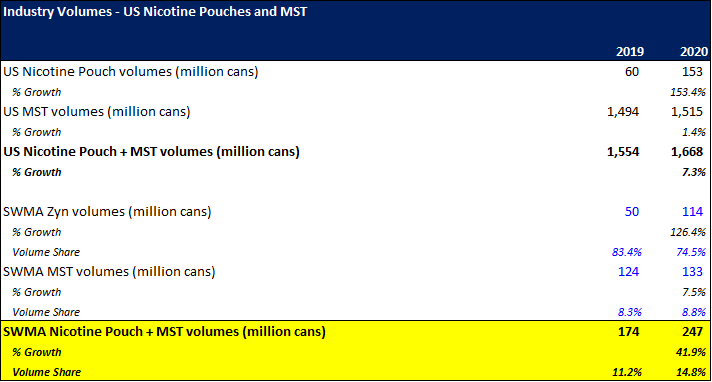
Zyn’s first-mover advantage in the US market contributed significantly to its ~74.5% market share in nicotine pouches during FY2020. However, although its volume share has fallen into the low 50s, its dollar share – the more informative KPI – has remained above 70% in 2021. As previously mentioned, these share losses are the result of deep discounting by the likes of Altria and BAT, who have run promotions offering pouches for $0.99 (and in some cases even giving them away for free). Despite this promotional activity, Zyn’s overall dominance, specifically in the western region, has remained remarkable.
From: @LibrarianCap
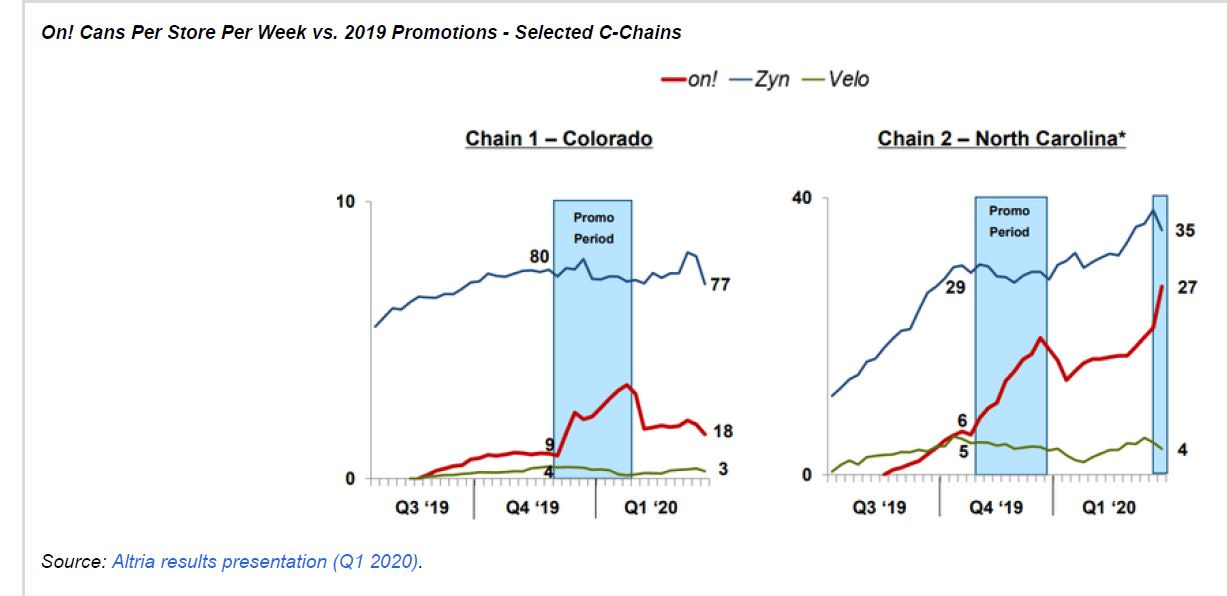
Promotional bumps at Altria, in particular, have been short-lived in Colorado, as customers have demonstrated that they prefer Zyn despite ASPs at Atria and BAT that are 41% and 51% lower, respectively. Said differently, consumers prefer Zyn despite ~69% higher ASPs than On (Altria) and ~104% higher ASPs than Velo (BAT).
From: @LibrarianCap
Likewise, Swedish Match has found it incredibly difficult to crack BAT’s leadership position in Scandinavian pouches as the distant #2 player. These relatively persistent market share dynamics demonstrate high customer loyalty within nicotine pouches, aided by operant conditioning in the form of nicotine stimulation.
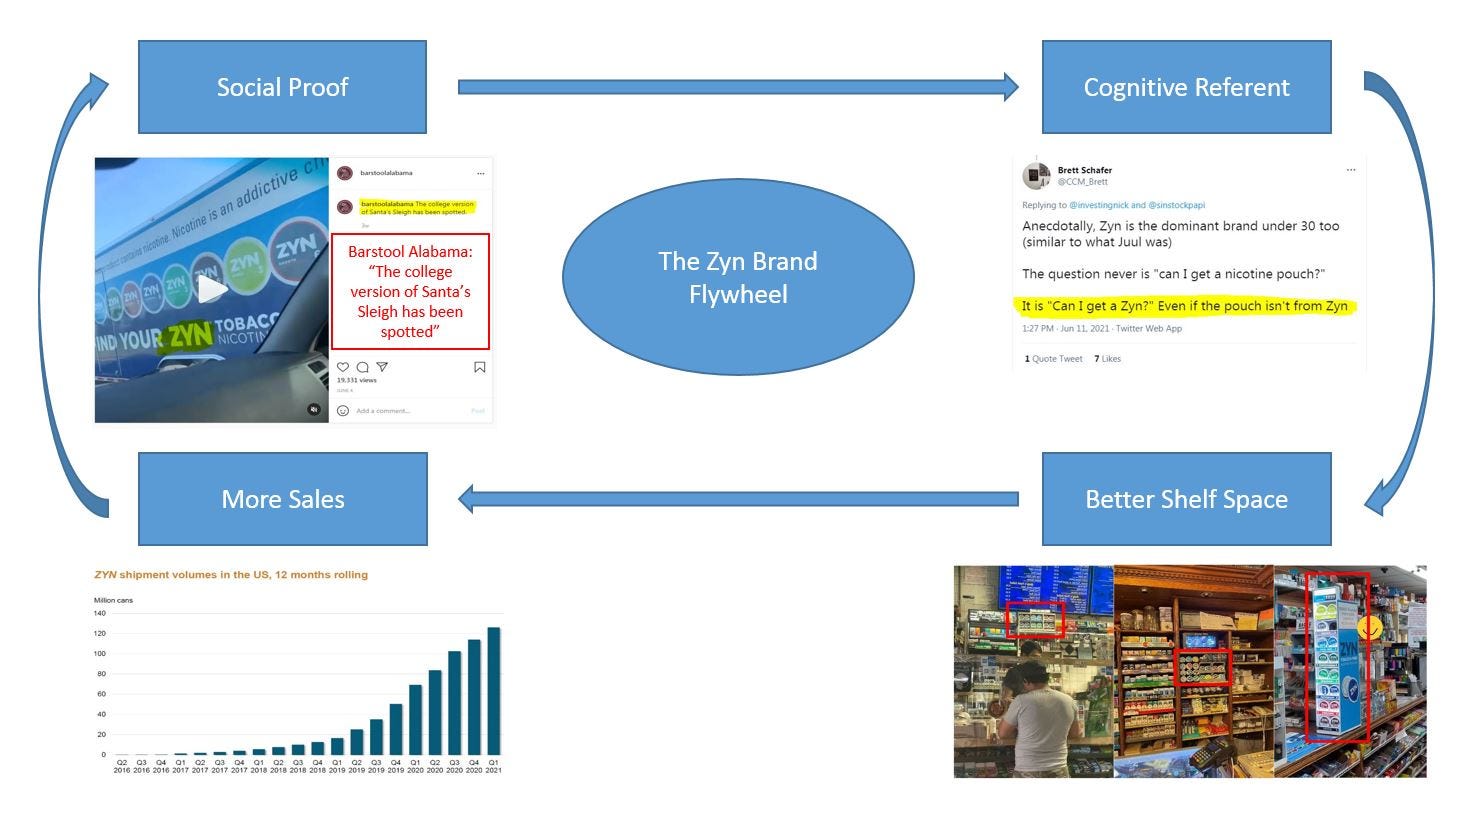
Normally, market share dynamics would not be elements of an effective moat. However, in the nicotine category – except for gums – most advertising is extremely limited by law. Therefore, new nicotine businesses (in new product categories) must establish brands through a combination of social proof, cognitive referents, and priority shelf space. More purchase volumes lead to stronger social proof, which leads to the development of category cognitive referents, which lead to better shelf space in distribution outlets, and so on. This positive feedback loop leads winners to compound advantages as the flywheel spins, making it extremely difficult for challengers to steal share once an early leader is established in a new nicotine product category. As we highlighted earlier, both customers and distribution channels have clear incentives to participate in the “Zyn flywheel” due to UX benefits and positive unit-economic contributions, respectively.
Zyn is the category Cognitive Referent
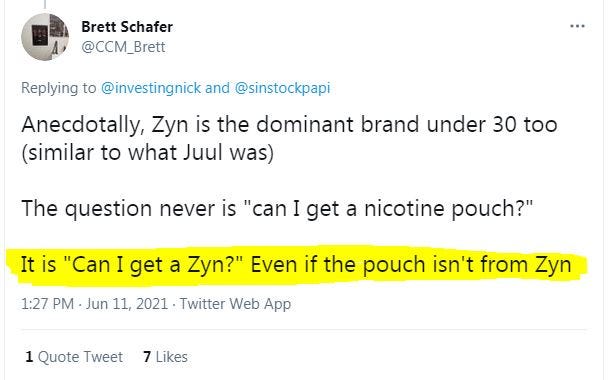
In new nicotine categories, the category leader’s brand often becomes a cognitive referent for the entire category, which helps contribute to a level of rigidity in regional market share dynamics of new nicotine categories due to: (1) lowered search costs (no advertising); and (2) mimetic consumer desire. For example, customers ask for a JUUL when they really should be referring to a closed-system vape. Similarly, they think of an iQOS when they really should be thinking of an HTU. Interestingly, despite intense price competition from BAT in both product categories, both JUUL and iQOS have fared incredibly well. JUUL ended 2020 with ~63% US retail share in the vape category (despite actively trying to slow its growth because of FDA investigation), and iQOS ended 2020 with ~78% global retail share in the HTU category. We currently see this same dynamic in nicotine pouches, where Zyn comprises 70%+ of the total category spend in the US and maintains increasing velocities (cans/store/week) despite ~69% higher ASPs Altria and ~104% higher ASPs than BAT. Assuming that the US nicotine pouch category develops similarly to other RRPs, where brand and first-mover advantage have been of greater relative importance than scale, Zyn should retain its leadership position and should exhibit characteristics of persistent economic profitability (i.e., a moat).
2. Strong Incremental Returns - Zyn:
In the next section, Management Analysis, we will touch on the capital return metrics for SWMA’s entire business. However, this subsection will focus on exploring the incremental returns on SWMA’s US Zyn business.
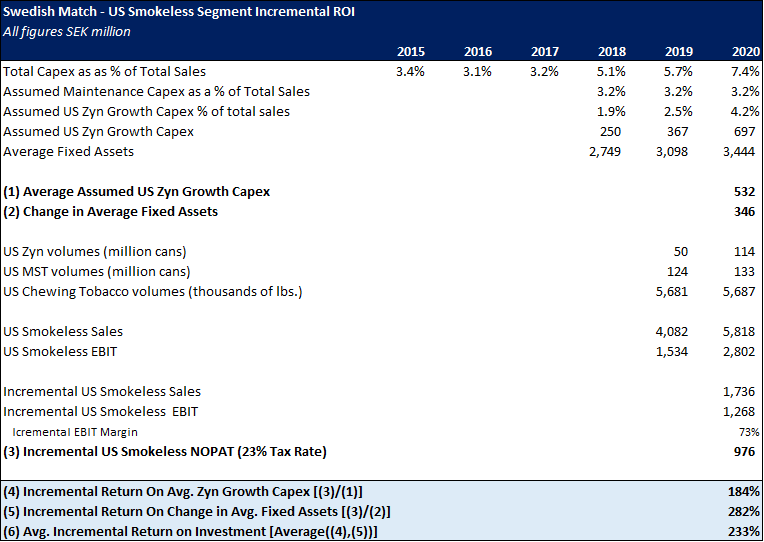
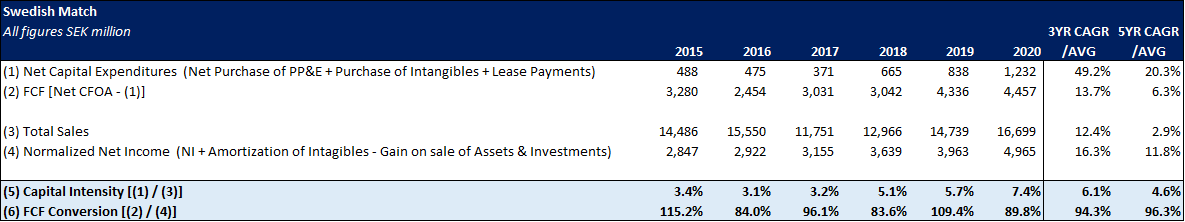
SWMA does not break out the composition of its US Smokeless business or its capital expenditures; however, it is easy to see that almost all of its incremental growth in the US was attributable to Zyn (see above: US Zyn volumes). In the interest of simplicity, we have imperfectly assumed that the incremental changes in the US Smokeless business serve as a rough proxy to Zyn’s incremental NOPAT profile in the US. SWMA’s actual change in invested capital and tangible capital were negative in 2020 due to buybacks, making them poor measuring sticks for marginal returns on Zyn in the US. Instead, we have chosen (1) average incremental growth capex and (2) the change in average fixed assets as our preferred denominators of return, as they likely reflect a more accurate picture of the marginal capital required to scale Zyn’s US business. Additionally, we have also assumed all capex – which we define as Net Purchase of PP&E + Purchase of Intangibles + Lease Payments – over 3.2% sales to be attributable to investments in Zyn’s US growth (i.e., in the table above as “Assumed US Zyn Growth Capex”).
From the figures in the table above – equations (4), (5), and (6) – it is clear that SWMA’s US Zyn business is nothing short of incredible (Avg. Incremental Return on Investment = 233%). Remarkably, 2021’s incremental returns may exceed those from 2020 as the business continues to scale. Growth capital expenditures will likely decrease as a proportion of revenues and incremental EBIT margins in the entire Smokeless segment (Scandinavia + the US) printed at 98.7% in Q1 of 2021 vs. the same period in the year prior. If Zyn can continue to grow in such a capital-efficient manner, it should meaningfully increase company-level capital efficiency as it becomes a larger and larger share of the business.
That means tendies, lots of tendies, for those of you keeping score at home. 🚀 🚀
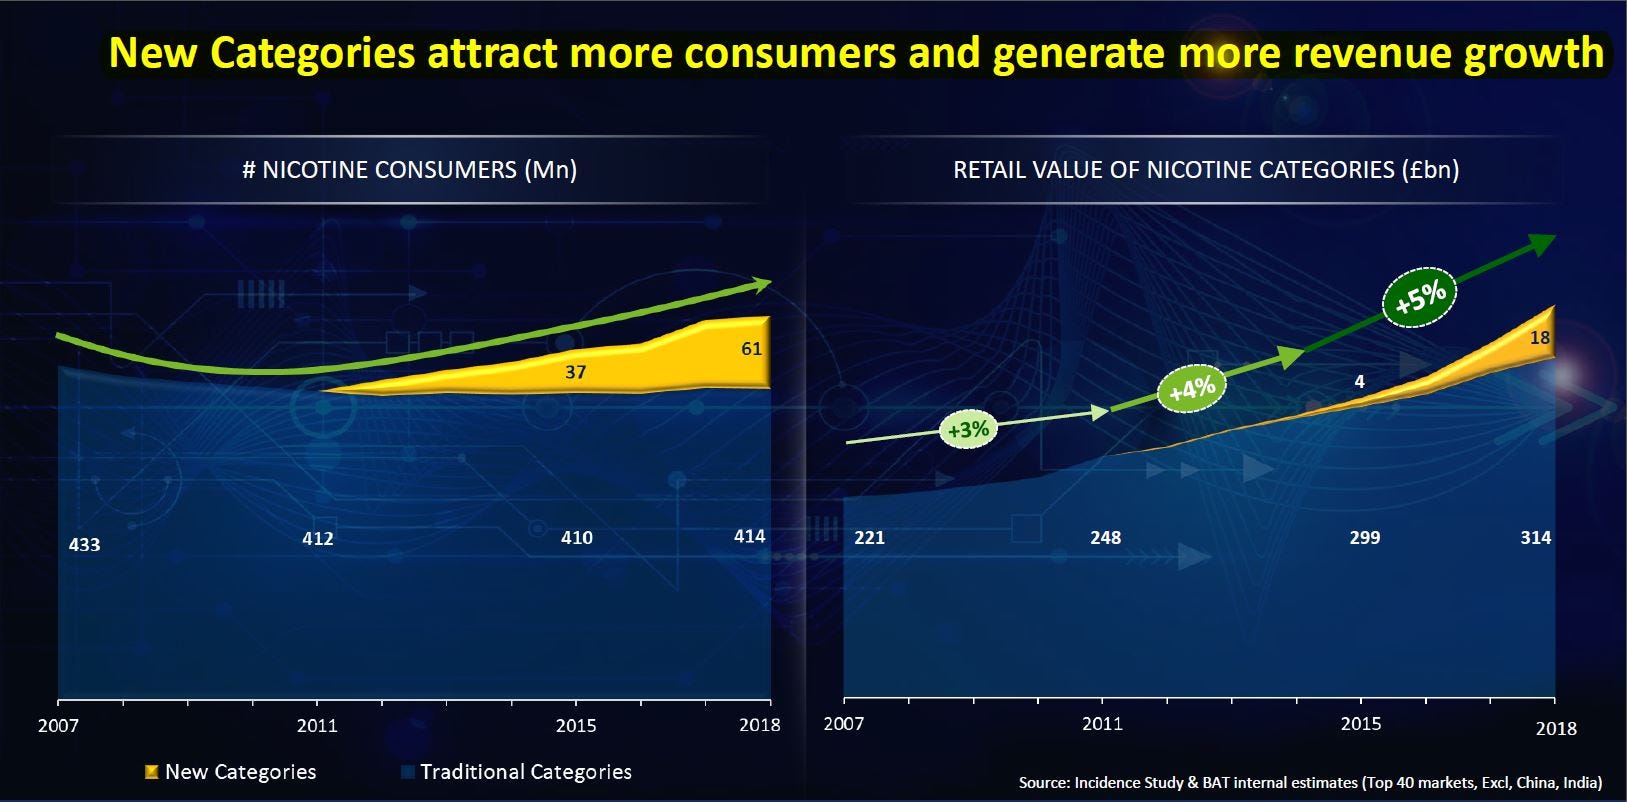
3. Long Runway for Growth: Nicotine Pouches and Cigars
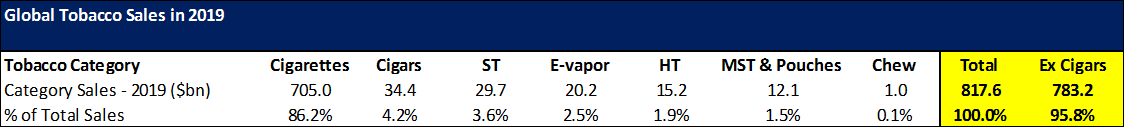
Contrary to popular belief, the number of nicotine consumers and retail value of nicotine categories is growing at an accelerating rate. Total global tobacco sales totaled ~ $817.6B in 2019. Assuming the midpoint of the industry’s historical growth rate of 3%, global tobacco sales would have totaled ~$842.1B in 2020 or ~7,750.7B SEK (using the average USD/SEK for 2020 of 9.2037). For reference, SWMA’s total Smokeless + Cigars revenue during 2020 was ~15.2B SEK. This implies a TAM penetration rate of ~0.2% on global tobacco sales in 2020. However, from the table above, it is clear that oral nicotine delivery methods comprise a smaller piece of the pie (~1.6% of total sales) than inhalation (~98.4% of sales). The global preference for inhalation as a nicotine delivery method can likely be explained by two objective variables: the speed and scale of nicotine delivery. Rigorous research in pharmacology has demonstrated that the addictiveness of any drug is directly proportional to the speed and scale of its delivery into the bloodstream and brain. Should scientific improvements allow oral to achieve a similar speed and scale of nicotine delivery to inhalation, the category floodgates should open.
Nicotine Pouches:
Nicotine pouches should have ample room for growth comprised of market growth and whitespace opportunity. Altria recently stated on their Q1 2021 earnings call that they believe the US nicotine pouch category can grow volumes at a 20-25% CAGR through 2026. This should imply a 25-30% CAGR through 2026 in the US retail value of the category (using standard MST price increases: ~5% pa). The whitespace opportunity is comprised of: increased frequency/intensity of use, longer customer lives, geographic expansion, and new nicotine customers.
As previously highlighted, one of the primary UX benefits of nicotine pouches is the opportunity for discrete usage in a professional setting (i.e., at one’s desk). We believe this will increase the frequency and intensity of nicotine pouch use and help drive usage velocity (cans/customer/week).
Likewise, increasing customer lives (i.e., +10 years vs. a cigarette smoker) due to product health benefits, presents nicotine pouch companies with the opportunity to add 10 additional years of cash flows per customer vs. traditional tobacco products (i.e., higher CLTV).
Geographic expansion is equally interesting. As shown in Key Fundamental Business Driver 2: Distribution, Zyn is only in ~100k retail outlets (sub 65% penetration of total US addressable stores), implying it still has an opportunity to increase its total US store count by 50%+. Adding another 55k stores at Zyn’s Q1 ‘21 velocity of ~24 cans/store/week and ~$4.95 Q1 ’21 ASPs would yield additional expected revenue of ~2.95B SEK (at current exchange rates), equivalent to ~51% of FY ‘20 US Smokeless Revenue (~5.82B SEK). At a constant exchange rate to FY ‘20 this expected revenue figure would be higher by ~6%. Staying with the geographic theme, SWMA only offers Zyn in the US and Scandinavia, which sport a combined population of ~353.1 million people. A simple geographic expansion into the rest of Europe would add ~431.5m potential new customers to SWMA’s opportunity set (~122% increase).
Finally, and perhaps most interestingly, pouches are bringing new non-traditional customers into the nicotine category. During BAT’s 2019 investor day presentation, the firm highlighted that 50% of nicotine pouch users were first-time customers. Furthermore, 50% of nicotine pouch users in Sweden are women, while TPB’s recent US test run of Fre also demonstrated that 20% of its extra-strength nicotine pouch users were women.
Cigars:
The global cigar market was valued at $36.7B in 2020 and is expected to grow at a CAGR of 11.5% through 2026. For illustrative purposes, SWMA’s US cigar sales comprised ~1.5% of the total global retail share. SWMA’s cigars segment will benefit from strong domestic market growth in the US and should trend closer to the 16% CAGR associated with legal cannabis because of new consumption patterns associated with cannabis legalization (i.e., blunt wrappers).
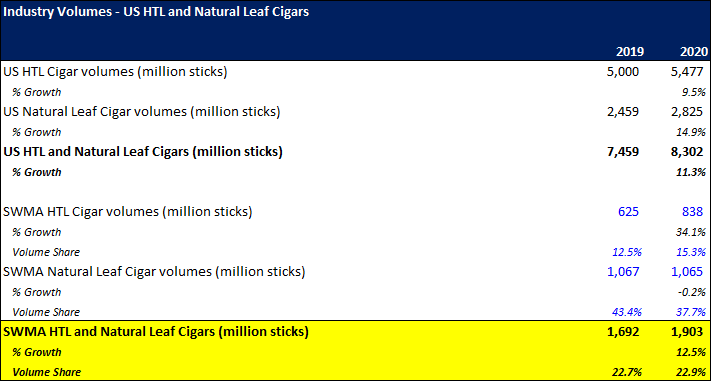
In SWMA’s HTL cigar segment, volumes, underpinned by White Owl, ended 2020 up 34.1%YoY in a remarkably similar fashion to Zig-Zag rolling papers. Coinciding with multiple state-level marijuana legalization announcements in the past few months, the US cigars industry has seen underlying volume growth accelerate to 20%+ YoY in each of the past three quarters. According to the Gallup October 2020 Poll, 68% of Americans now favor cannabis legalization, and White Owl presents an interesting opportunity to ride this secular tailwind in a business with strong incremental margins and pricing power (~69% incremental EBIT margin YoY and ~6% price increase YoY in Q1 2021). Geographic expansion in cigars is unlikely given SWMA’s spin-off and subsequent divestment of Scandinavian Tobacco Group A/S (“STG”) in 2017.
Management Assessment:
Culture Analysis
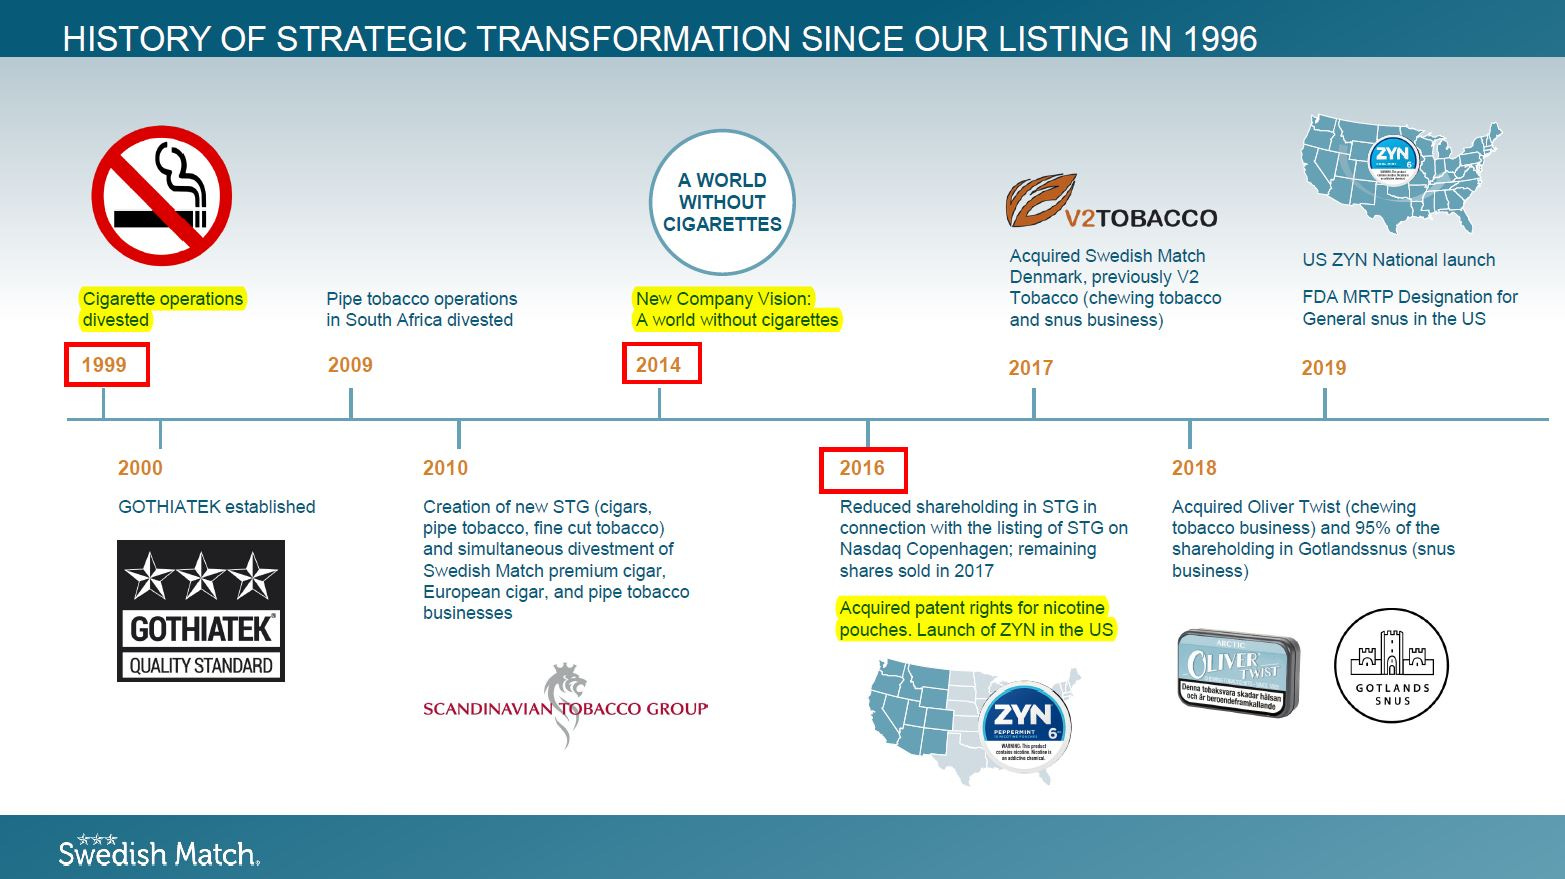
SWMA has one of the better cultures in the entire tobacco/nicotine complex. The company employs a decentralized approach characterized by local ownership and has been forward-looking as far as the industry is concerned. The firm divested its cigarette operations in 1999. It fully exited its STG (European cigars, pipe tobacco, and fine-cut tobacco) stake in 2017 while ramping Zyn in the same year. These actions are congruent with the company’s mission, “A world without cigarettes,” and demonstrate the company’s willingness to proactively innovate to meet changing consumer needs (see: Thomas Tull – The New Physics of Business). Furthermore, the firm’s willingness to present data that reflects poorly on management is also highly informational and underscores a culture of personal accountability that starts at the top.
Compensation Analysis
The management compensation policy at SWMA is comprised of four main components (1) base salary; (2) annual incentives; (3) long-term incentives; and (4) share ownership.
Base Salary
CEO base salary and benefits at SWMA were ~7.6 million SEK (~ USD 824k) and comprised 41% of total compensation in 2020. This is abnormally high compared to a much larger company like Altria, where the CEO base salary was only ~ USD 1.1 million (9% of total compensation).
Annual Incentive
CEO annual incentive compensation (cash award) was ~5.3 million SEK (~USD 571k) and comprised ~28% of total compensation in 2020. The max payout in 2020 was equivalent to 70% of base salary and was tied to two main performance metrics: total operating profit growth (75%) and core products sales growth (25%). The threshold for max payout in 2020 was very odd: ~9% for operating profit growth and ~10% for core products sales growth (i.e., operating de-leverage). For reference, the 3-year CAGRs for operating profit and core product sales were ~18.3% and ~12.7%, respectively. Interestingly, the intention is to have executives commit 50% of the after-tax value of their cash award to share purchases in the open market that must be held for at least 3 years (failure to comply with this policy results in a reduction in max payout from 70% to 50% of base salary).
Long-term Incentive
CEO long-term incentive compensation (cash award) was ~3.2 million SEK (~USD 344k) and comprised 17% of total compensation in 2020. The max payout in 2020 was equivalent to 70% of base salary and was tied to two main performance metrics: total operating profit growth (75%) and core products sales growth (25%). Here the maximum payout thresholds seem to be an adequately ambitious hurdle. The firm outperformed the cumulative operating profit target by ~19% and the cumulative core product sales target by ~10%. The policy also requires that executives commit 100% of the after-tax value of the award to share purchases in the open market, which must be held for at least 2 years.
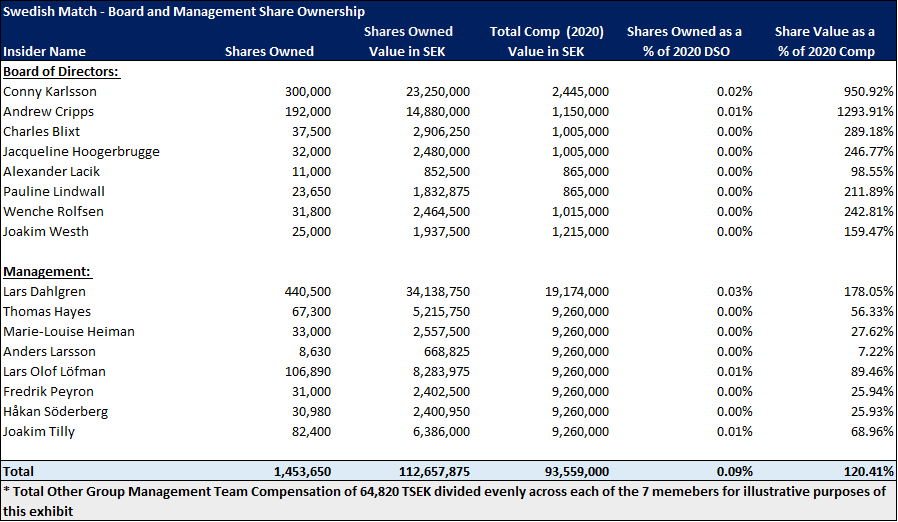
Insider Share Ownership
General Comments
The compensation scheme would be better if it were reversed such that the LTIC was the largest component and the base salary was the lowest to improve the ratio of at-risk pay from 45% to 69%. It would also be beneficial if a ROIC hurdle was included in the LTIC performance criteria and minimum share ownership associated with the policy was increased from 2 to 5 years. Additionally, management share ownership is underwhelming relative to total comp, so a policy requiring management to own shares equivalent to 5x total comp would create better alignment with shareholders. Management’s share ownership relative to total comp is poor compared to other firms in the industry. That being said, the CEO’s total comp of ~USD 2 million in FY ‘20, was peanuts relative to his contribution to shareholder wealth: SWMA has a 5-YR TSR CAGR of ~25.2% (~208.2% cumulatively over the past 5-YR period).
Capital Allocation Analysis
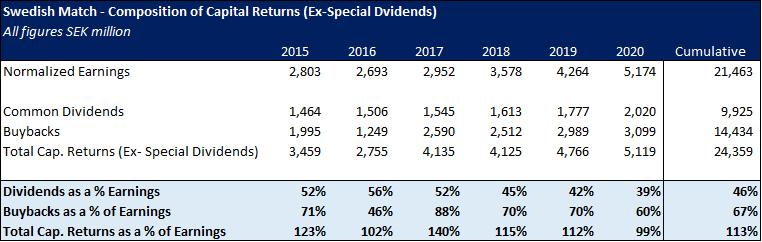
Although SWMA enjoys an extremely favorable industry structure, management has also demonstrated that they are among the best capital allocators in the industry. Between Jan.1, 2015, and Dec. 31, 2020, management divested the STG stake (Scandinavian Tobacco Group), invested in nicotine pouches, and acquired various Snus brands, while returning ~30B SEK to shareholders (~60% of initial market cap) through a combination share repurchases, common dividends, and special dividends. Acquisitions have been small and targeted (i.e., focused on IP) and the capital return strategy is the most tax-efficient in the industry (excluding special dividends: ~6.7B SEK over the period). Buybacks have been the company’s preferred method of regular capital returns (vs. the industry norm of dividends). Total cumulative capital returns have exceeded both cumulative earnings and cumulative free cash flow as management has employed a levered capital return strategy similar to the one popularized by John Malone (albeit at a much lower net leverage ratio of ~2x Net Debt/EBITA over the period). The results of the capital allocation policy have been impressive: explosive growth coupled with increased capital efficiency and added juice for equity holders. SWMA effectively combines the best qualities of KO and CHTR, but with lower maintenance capex requirements, better incremental returns, and faster growth.
Risks – i.e., The Bear Case:
1. Government Regulation
Governments will aggressively regulate nicotine pouches just like vapes because of youth usage. Excise taxation on RRPs will be similar to that of traditional tobacco products. Flavor bans will kill the business.
i. Mitigant 1:
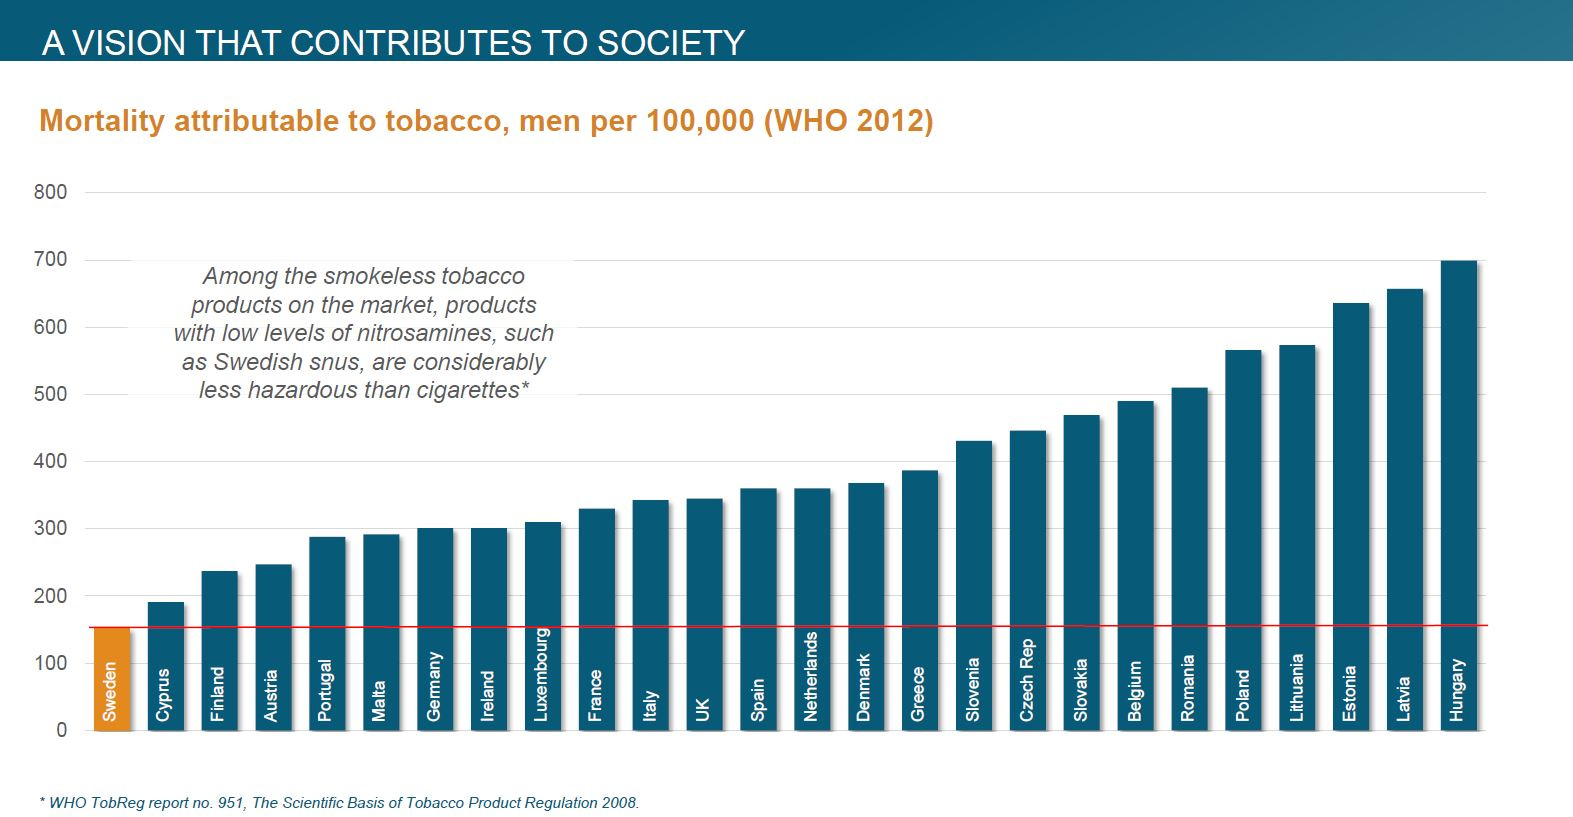
Sweden has the EU’s lowest male mortality rate attributable to tobacco…
… because they’ve embraced Oral!
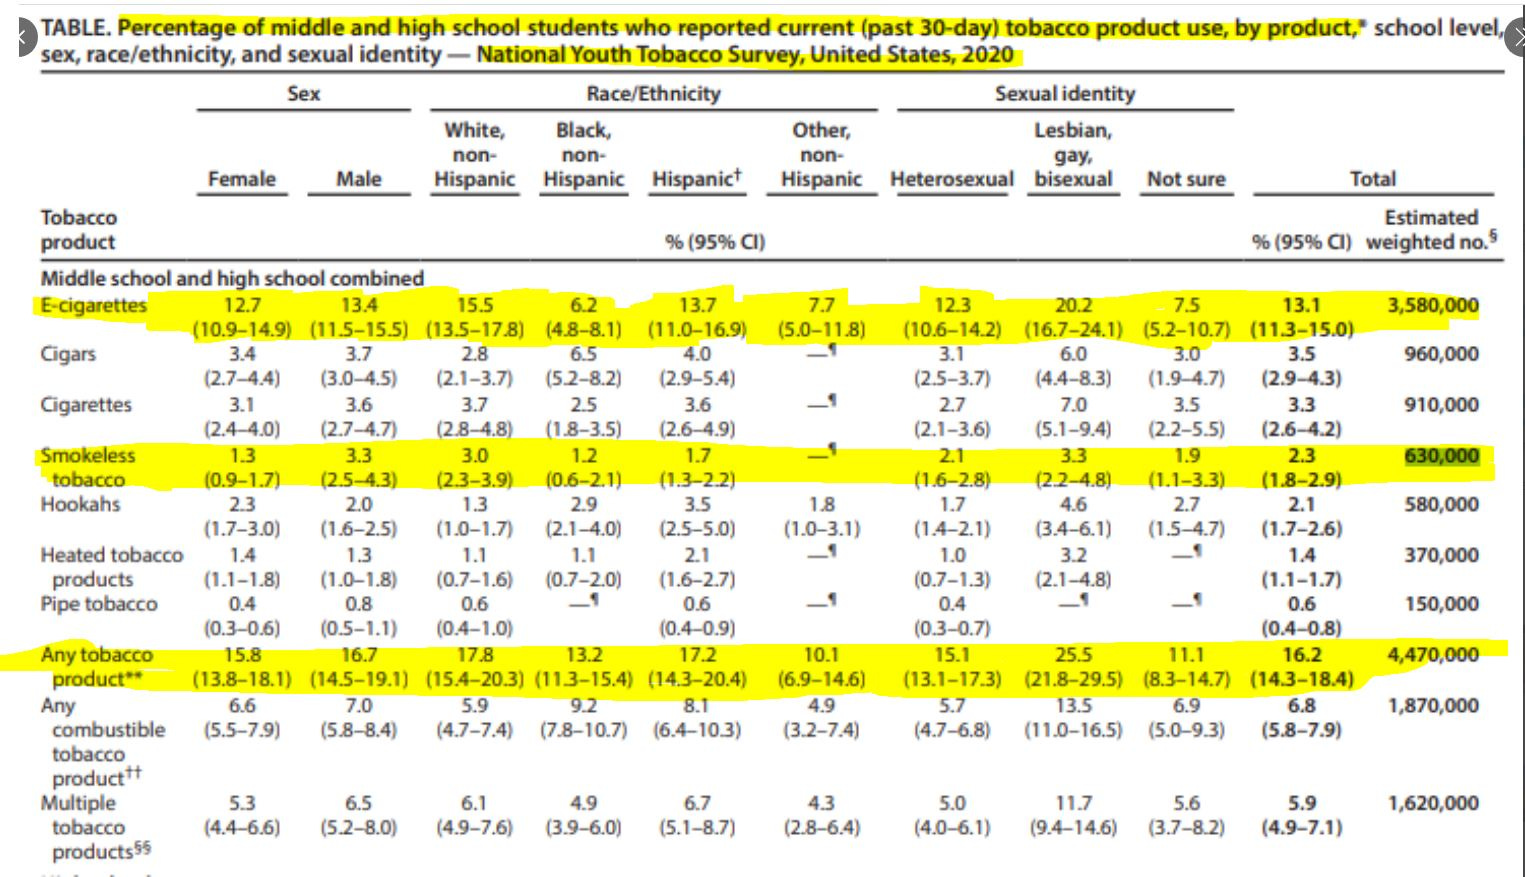
Governments are extremely unlikely to regulate nicotine pouches aggressively, like vapes, because of clear societal benefits and minimal youth usage. Peak vape usage in the CDC National Youth Tobacco Survey (“NYTS”) was in the range of ~20-25% of the total middle and high school population. Differently, smokeless tobacco – which includes nicotine pouches – had a prevalence of ~2.3% in the 2020 CDC NYTS survey of the same population. The difference in magnitude is approximately 8-10x (1 in every 4 or 5 kids vs. 1 in every 40 kids). See Appendix E for the survey results.
Excise taxation on RRPs will also likely be lower than traditional tobacco products because governments will likely want to incentivize consumers to switch to RRPs. This is because RRPs are the rare win-win outcome for customers, regulators, and taxpayers (in countries with universal healthcare – i.e., lower healthcare costs). Sweden also has the lowest male mortality rate associated with tobacco in the EU, and it’s likely other countries want to emulate this success.
Flavor bans are also unlikely to kill the business. As of June 1st, 2021, flavored nicotine pouches were banned in Massachusetts. The result? A migration in velocities (cans/store/week) from flavored SKUs to unflavored SKUs. SWMA does not see declines in velocities across regions with flavor bans. Any future flavor bans in the cigars category will likely see a similar outcome to nicotine pouches: a simple migration from flavored to unflavored SKUs.
2. Competition
SWMA lacks distribution, regulatory, and scale advantages relative to Altria and BAT in nicotine pouches. Nicotine pouches can never be a great business because the oral delivery method will never compete with inhalation. (i.e., oral nicotine diffusion speed/scale will never reach parity with inhalation).
i. Mitigant 2:
As discussed in Thesis 1) and the Competition Analysis section: Yes, SWMA lacks scale, distribution, and regulatory advantages relative to Altria and BAT. However, in the US, consumers have demonstrated a willingness to pay up for Zyn, as demonstrated by its 70%+ retail dollar share despite ~69% and ~104% higher ASPs than Altria and BAT, respectively. In Scandinavia, this is an unmitigated risk as BAT is clearly the leader.
Switching gears, even if the diffusion of nicotine never reaches parity with inhalation, there will be some cigarette or MST users who migrate simply for the health and hygiene benefits. If 5% of smokers switched to oral nicotine globally, the TAM would expand from ~$13.65B to ~$51.14B. This scenario would yield a ~3% TAM penetration in a TAM growing 5-7% per year at relatively advanced maturity. So even under conservative scenarios, this investment can work. You can find a more detailed summary of the competitive overview in Appendix G: Competitive Overview.
3. Decreased Nicotine Consumption
Nicotine is a secularly shrinking business.
i. Mitigant 3:
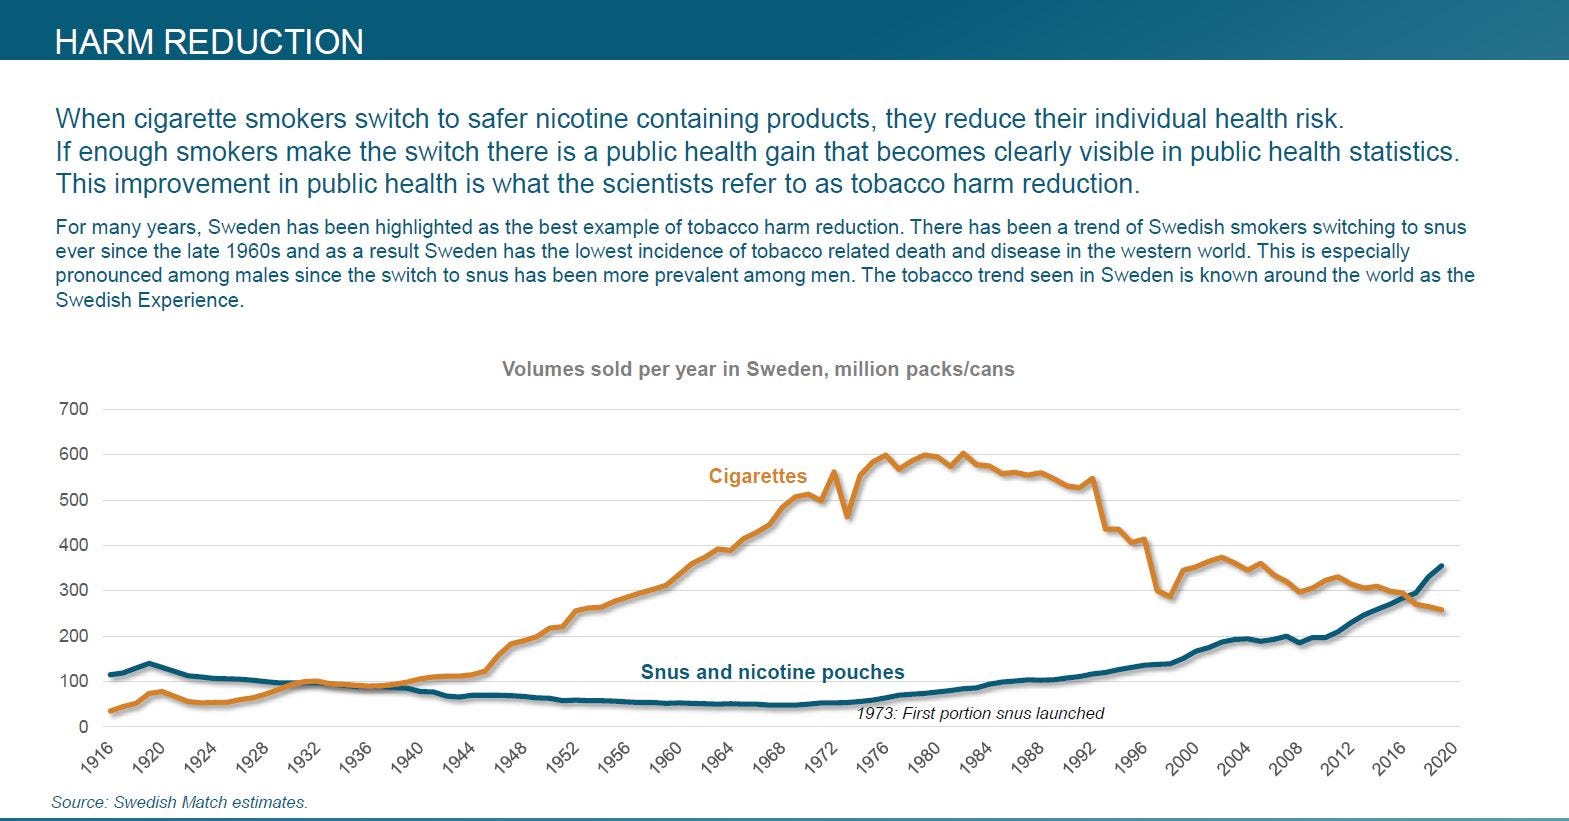
False, as depicted in the chart from Investment Thesis 3: Long Runway for Growth, it is clear nicotine customer counts and retail category value are increasing at an accelerating rate.
Even if nicotine volumes were to decline again (unlikely at this juncture), a simple look at cigarette volumes decline since 1980 vs. business performance and the share prices of cigarette companies over the same period would have yielded significant outperformance relative to the S&P.
Furthermore, vices are Lindy and a feature (not a bug) of the human condition. Humans have been consuming nicotine for 5000+ years, and we should expect – from the Lindy effect – that this phenomenon will continue to persist.
4. Shifting Profit Pool
The primary distribution channel of Tobacco products, c-stores (90% of cigarettes and 97% of OTP), remain extremely fragmented. In the US, the largest player comprises less than 10% of the market, while mom and pops comprise ~62% of the industry. Should meaningful consolidation occur in the c-store space, some relative bargaining power could begin to shift away from Tobacco co.’s and towards c-store operators (i.e., think of an aggregator).
i. Mitigant 4:
Regulators were extremely critical of Seven & I’s acquisition of Speedway and will likely limit consolidation before it becomes an issue to tobacco companies. If regulators do not limit consolidation, this is an unmitigated risk. However, it should be fairly obvious from a distance, and we as investors should be able to recalibrate accordingly (similar to the Peter Lynch comments on Dunkin Donuts).
Valuation:
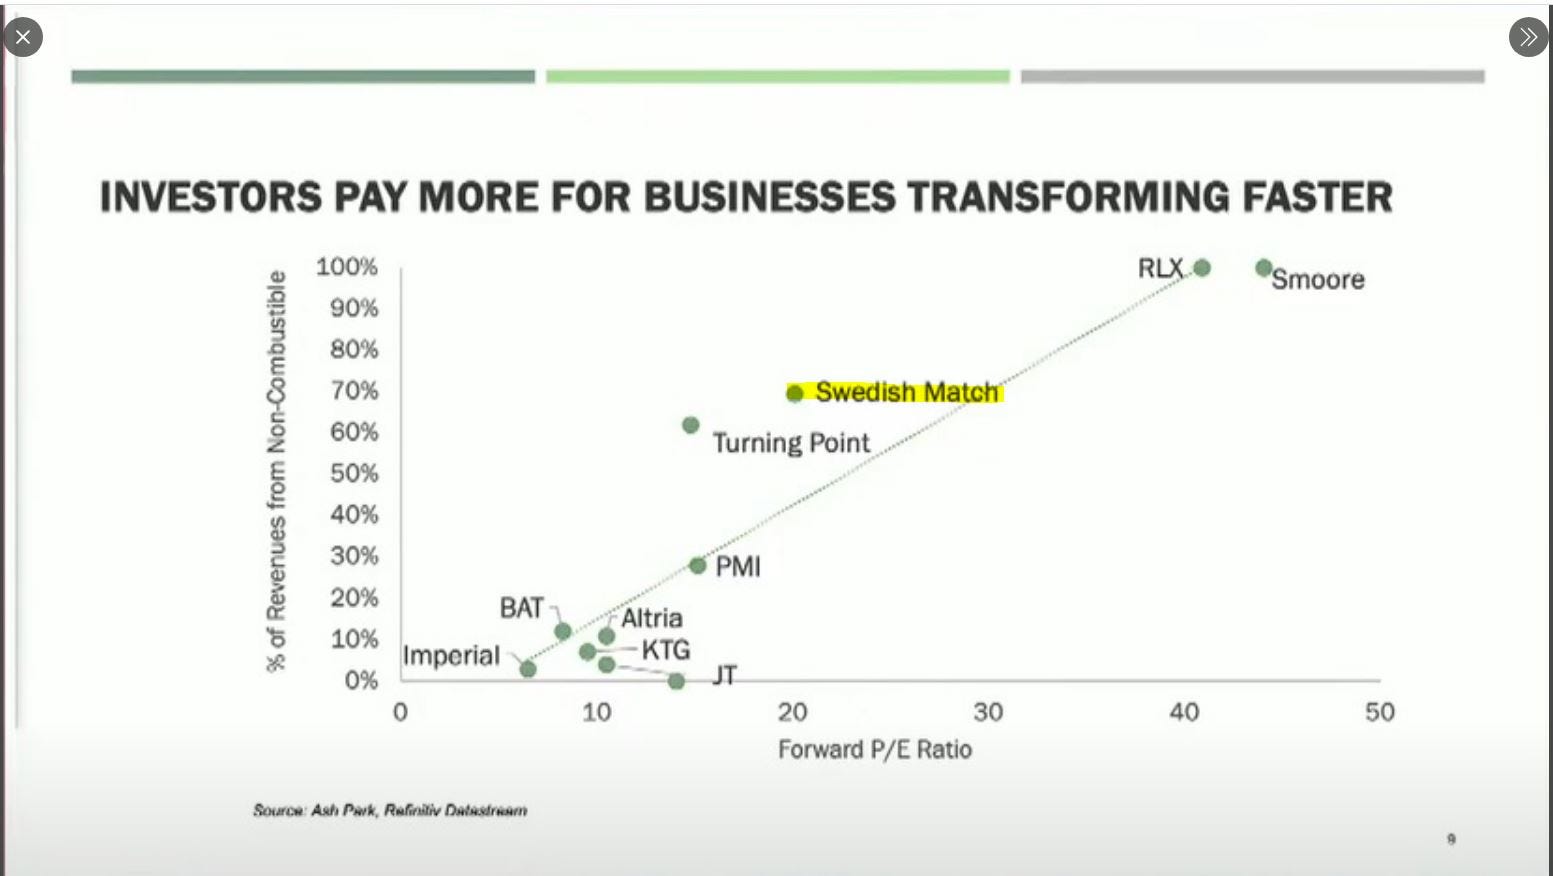
Sanity check: this presentation slide from @JonFell73 of Ash Park Capital yields a similar valuation to our base case (~30x forward earnings).
Revenue:
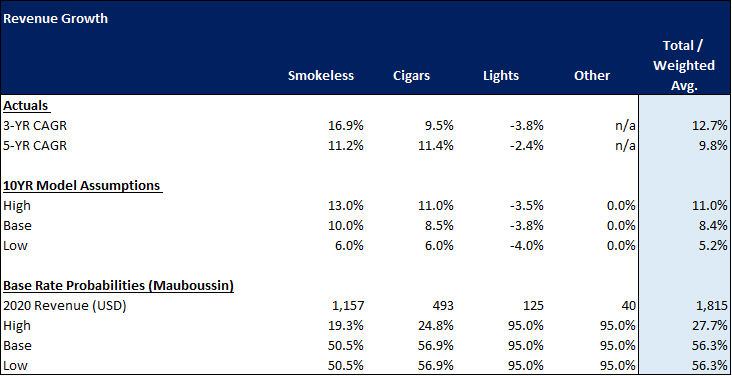
The base-rate weighted probabilities would suggest that the most likely outcomes of our model sit between our base case and our bear case (~56.3%). Furthermore, we believe each of our revenue growth cases are relatively conservative compared to either actual performance or market growth figures. For example, our bull case for Smokeless implies a ~3.4x in sales over 10 years. Meanwhile, Altria predicts the US pouch category will ~3.1x to ~3.7x over the next 5 years.
Likewise, our bull case for SWMA implies an 11% growth rate through the next 10 years for Cigars. Global category growth rates are projected to come in at 11.5% per year through 2026 and fail to account for the secular demand lift in the US from cannabis (3 straight quarters of 20%+ volume growth).
Furthermore, both categories have demonstrated 5-6% price increases in the past, are in intangibles-based/capital-light businesses, and have small TAM penetrations relative to their opportunity sets. From Mauboussin’s more recent work, it is clear intangibles-based businesses, “should expect to see faster growth rates for the winners than we have seen in the base rate data,” presented in his 2016 publication, The Base Rate Book.
Available in Appendix A, our base case revenue assumptions yield a ~0.4% TAM penetration rate by year 10 in the financial model. We believe this underscores our conservatism relative to the firm’s potential opportunity.
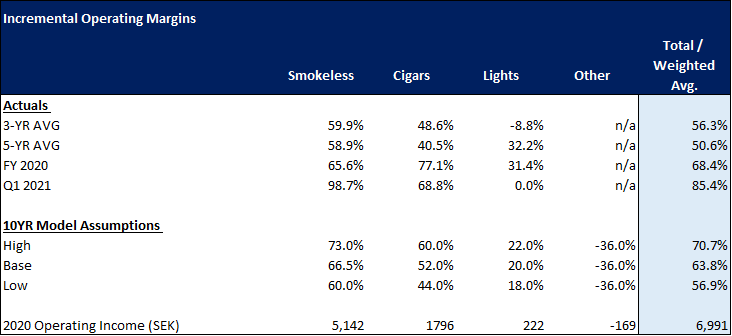
Incremental Operating Margins:
Again we feel as if our assumptions concerning incremental operating margins are fairly accurate as well. Each of our model assumptions fall within the historical ranges exhibited by each business segment. As one would expect in a business with operating leverage, incremental margins in both the cigars and smokeless segments have demonstrated a trend of increasing over time. In fact, our model assumptions in our bull case for incremental operating margins have undershot the actual incremental operating margins displayed in Q1 2021 by 1470 bps (Weighted Avg: Q1 2021 vs. 10YR Model Assumptions - High).
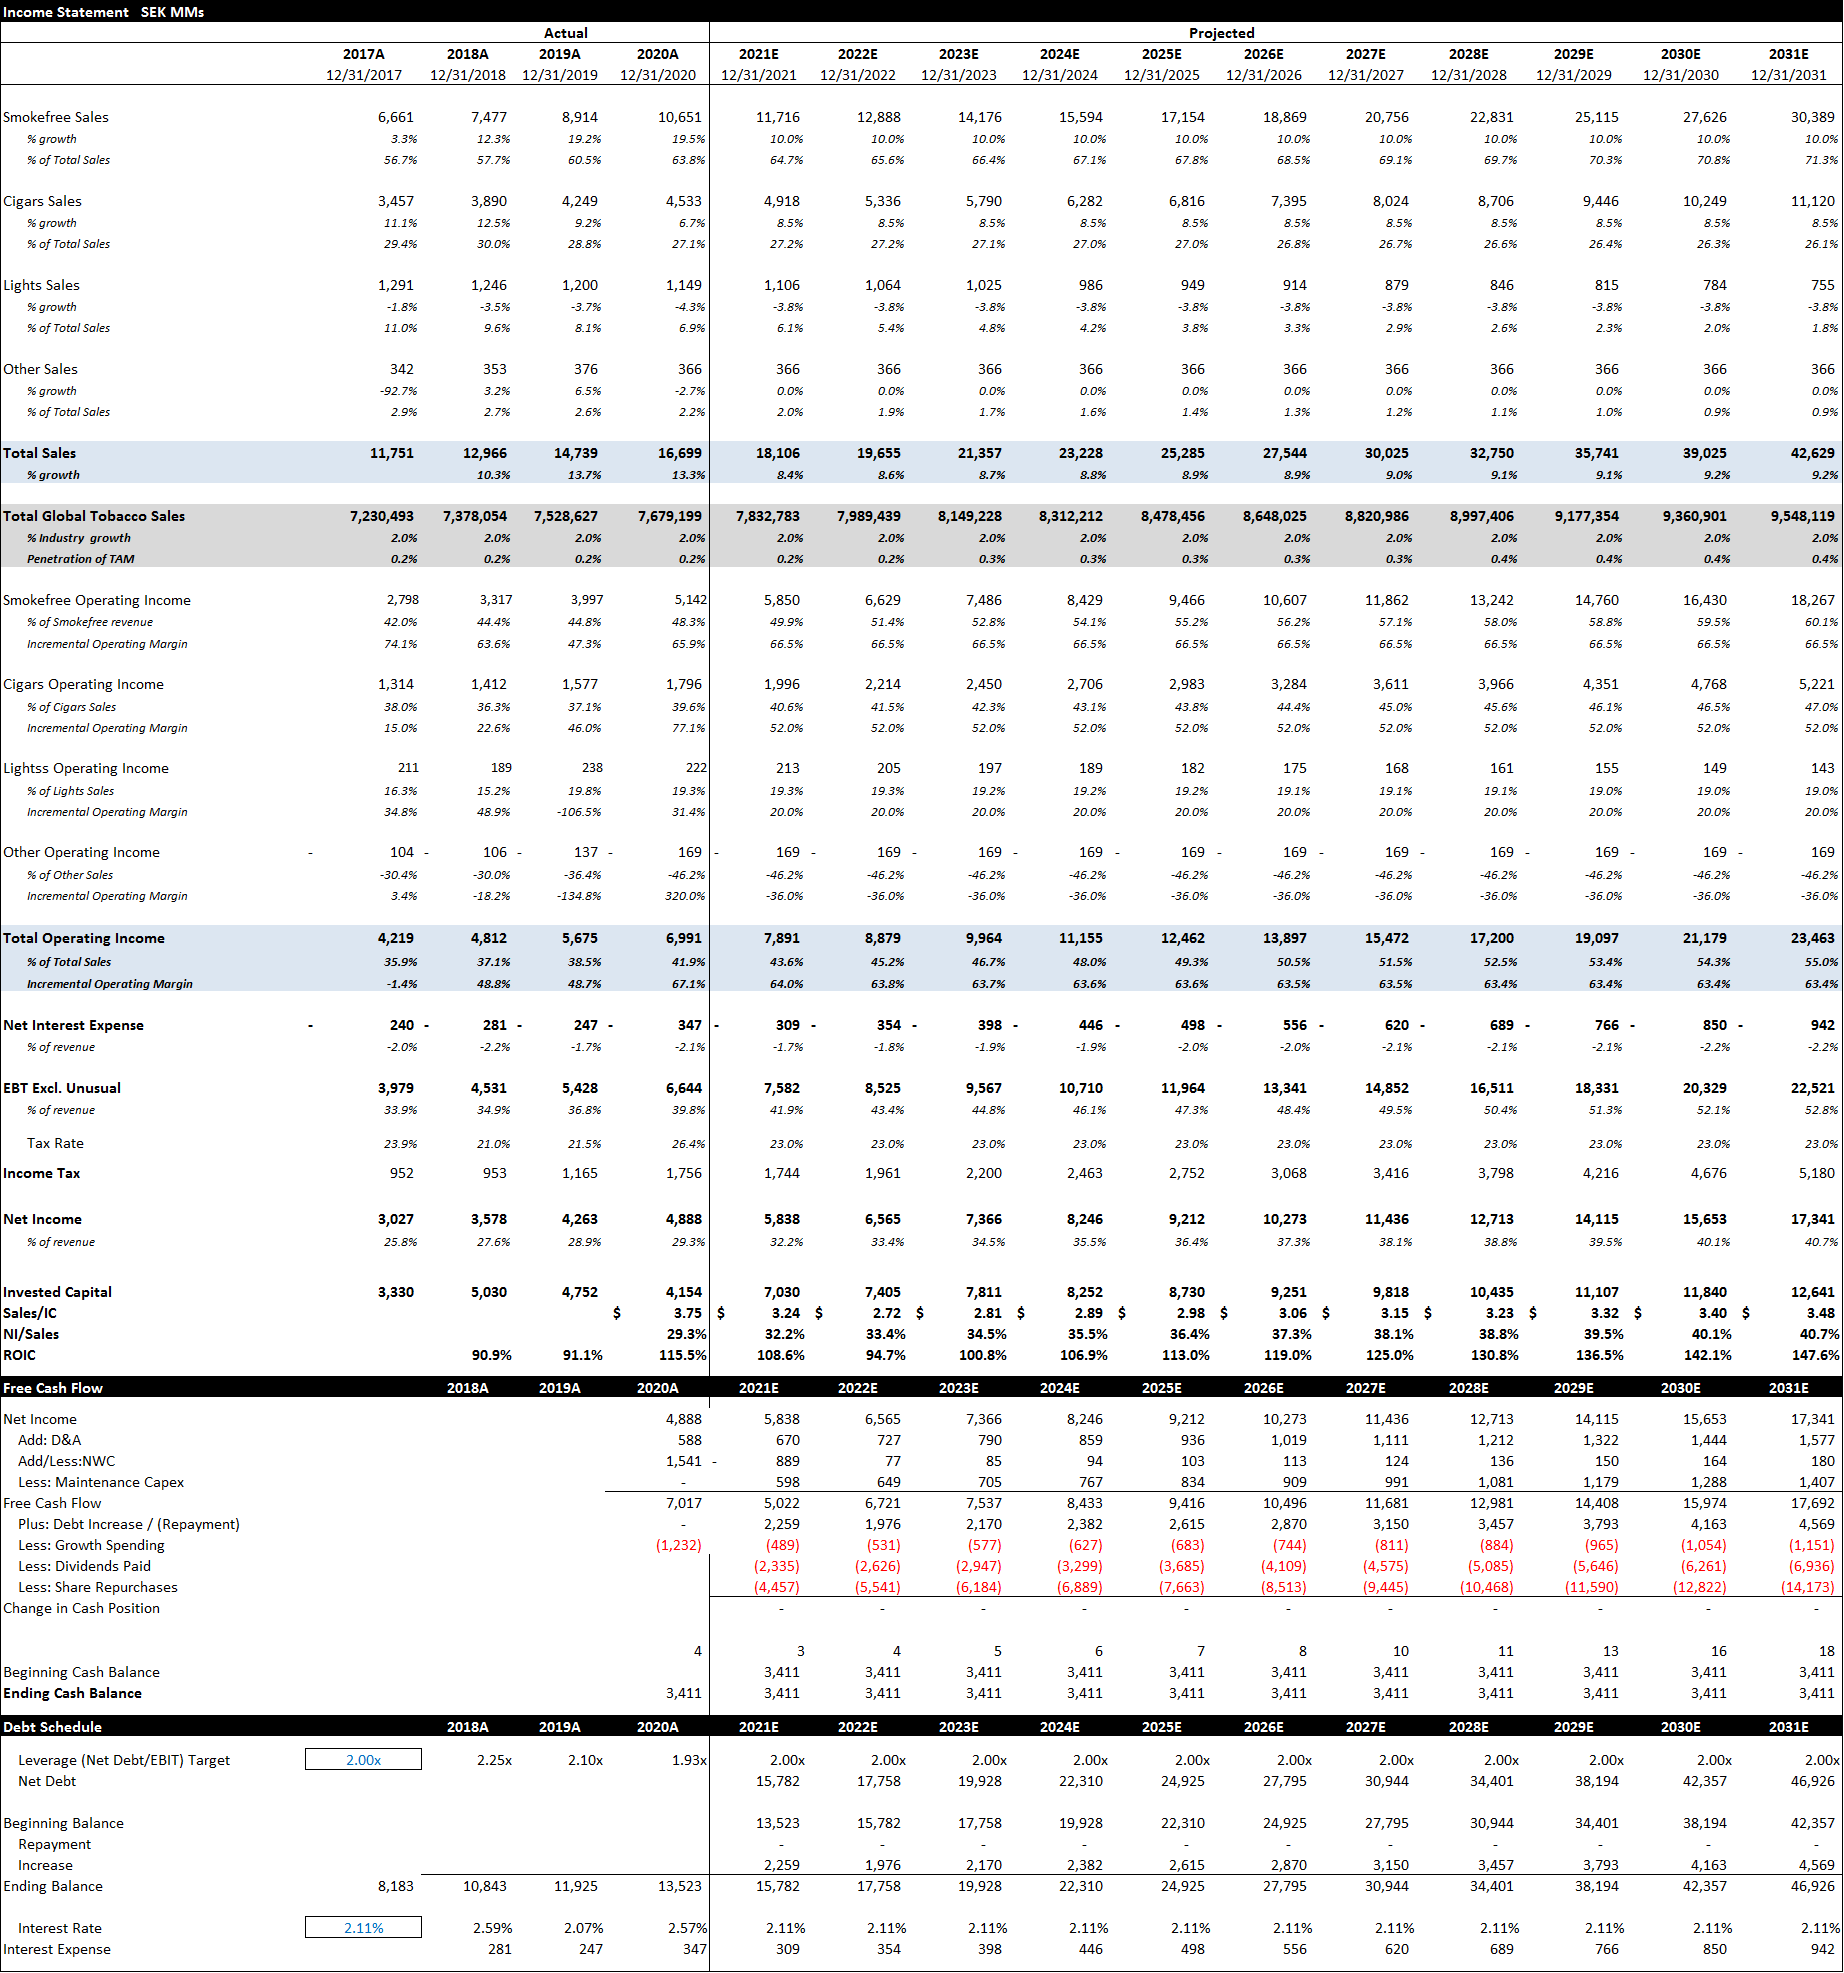
D&A and Capex:
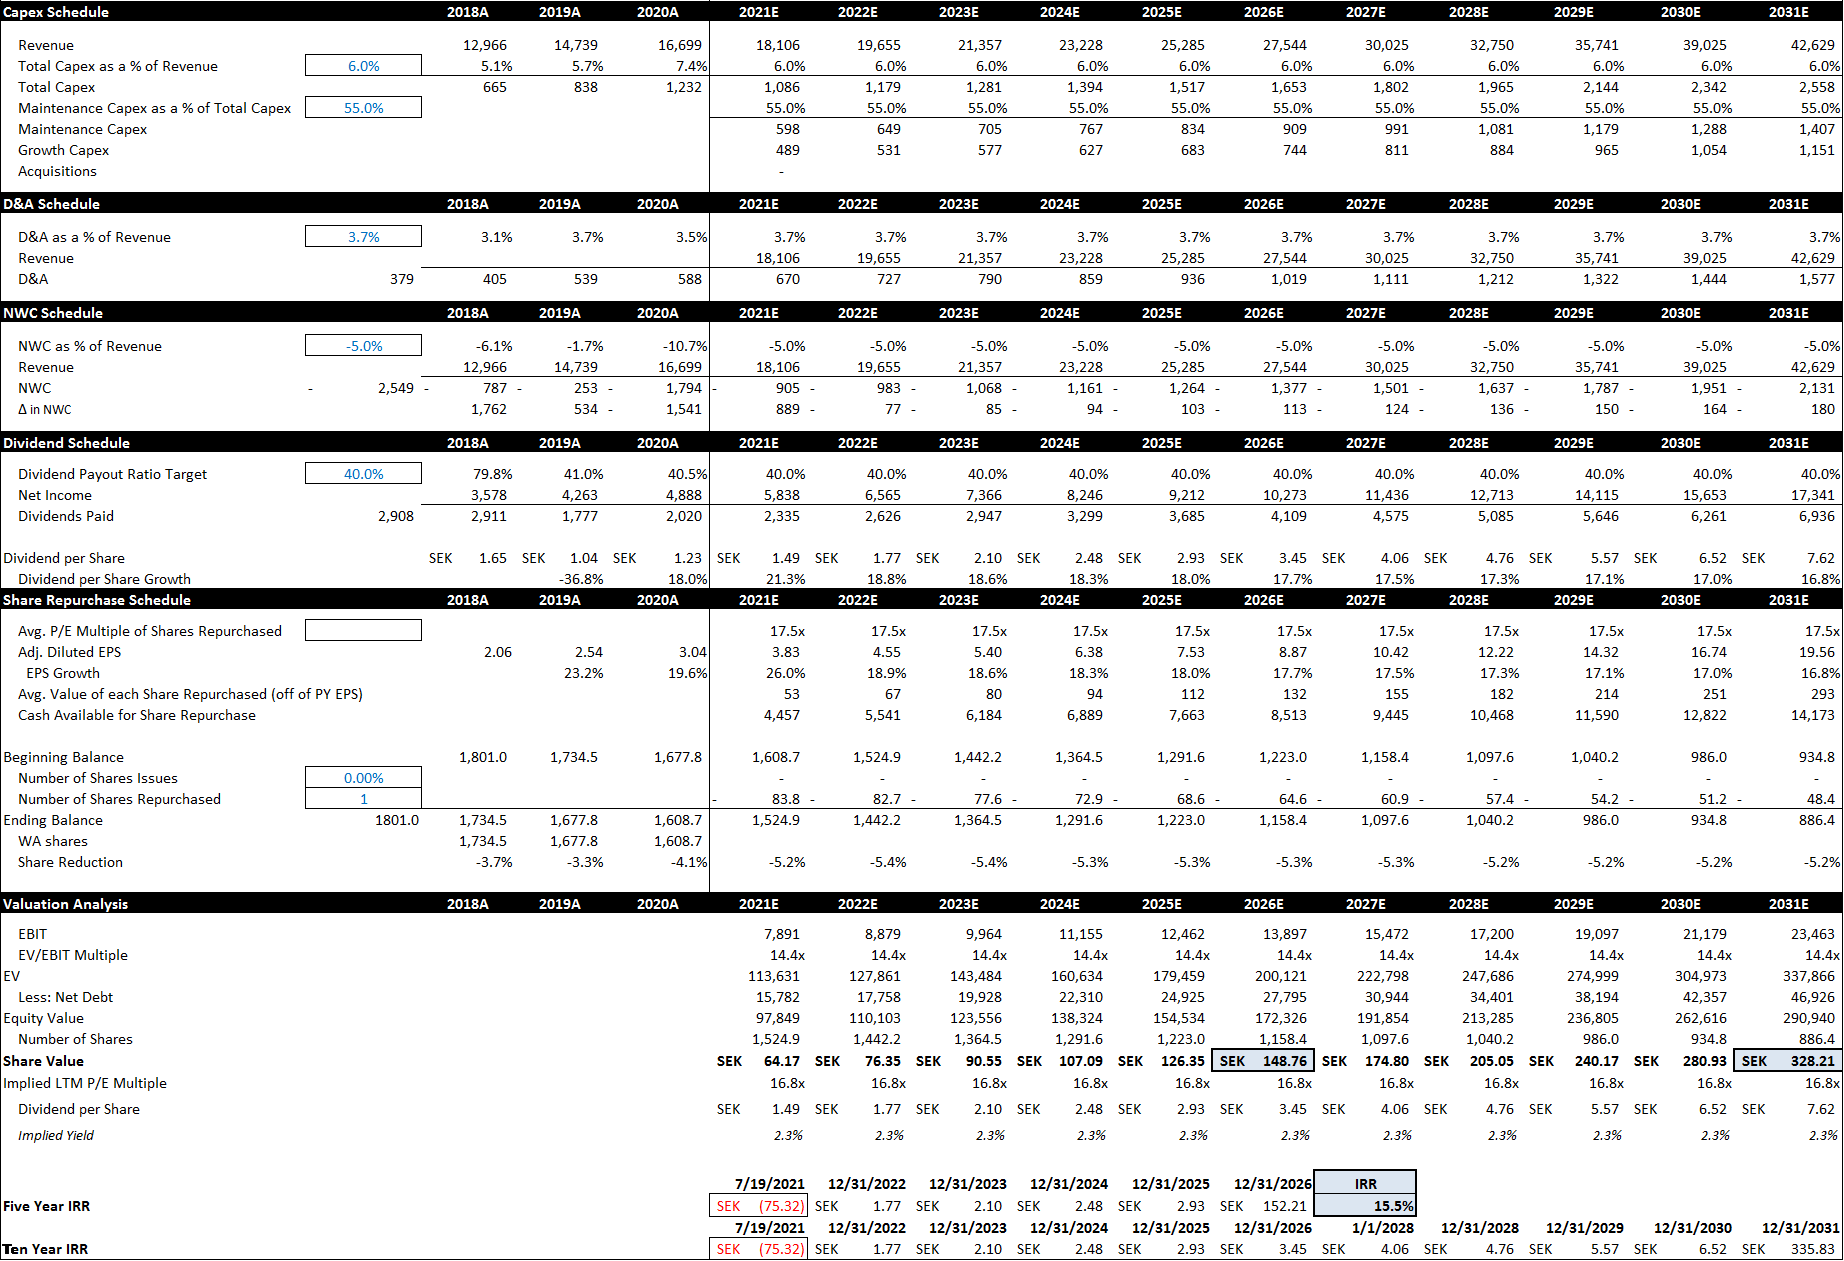
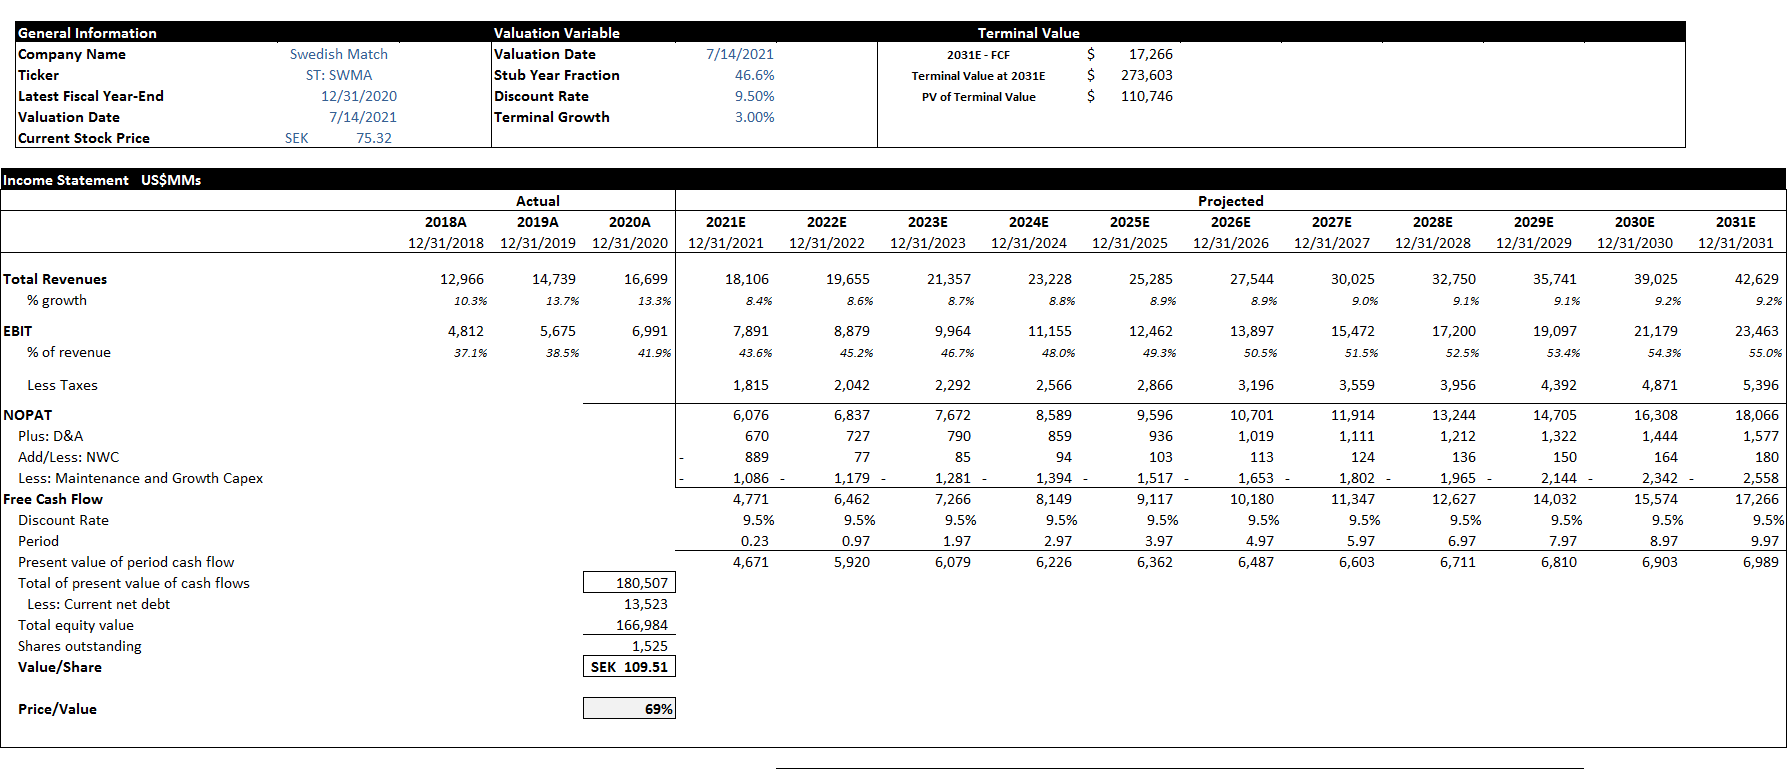
We’ve modeled D&A at 3.7% of sales and Capex at 6.0% of sales through the forecast period. D&A is in line with historical levels, while 6.0% represents a step down from the 7.4% from 2020 but is nearly double the historical avg. pre-Zyn.
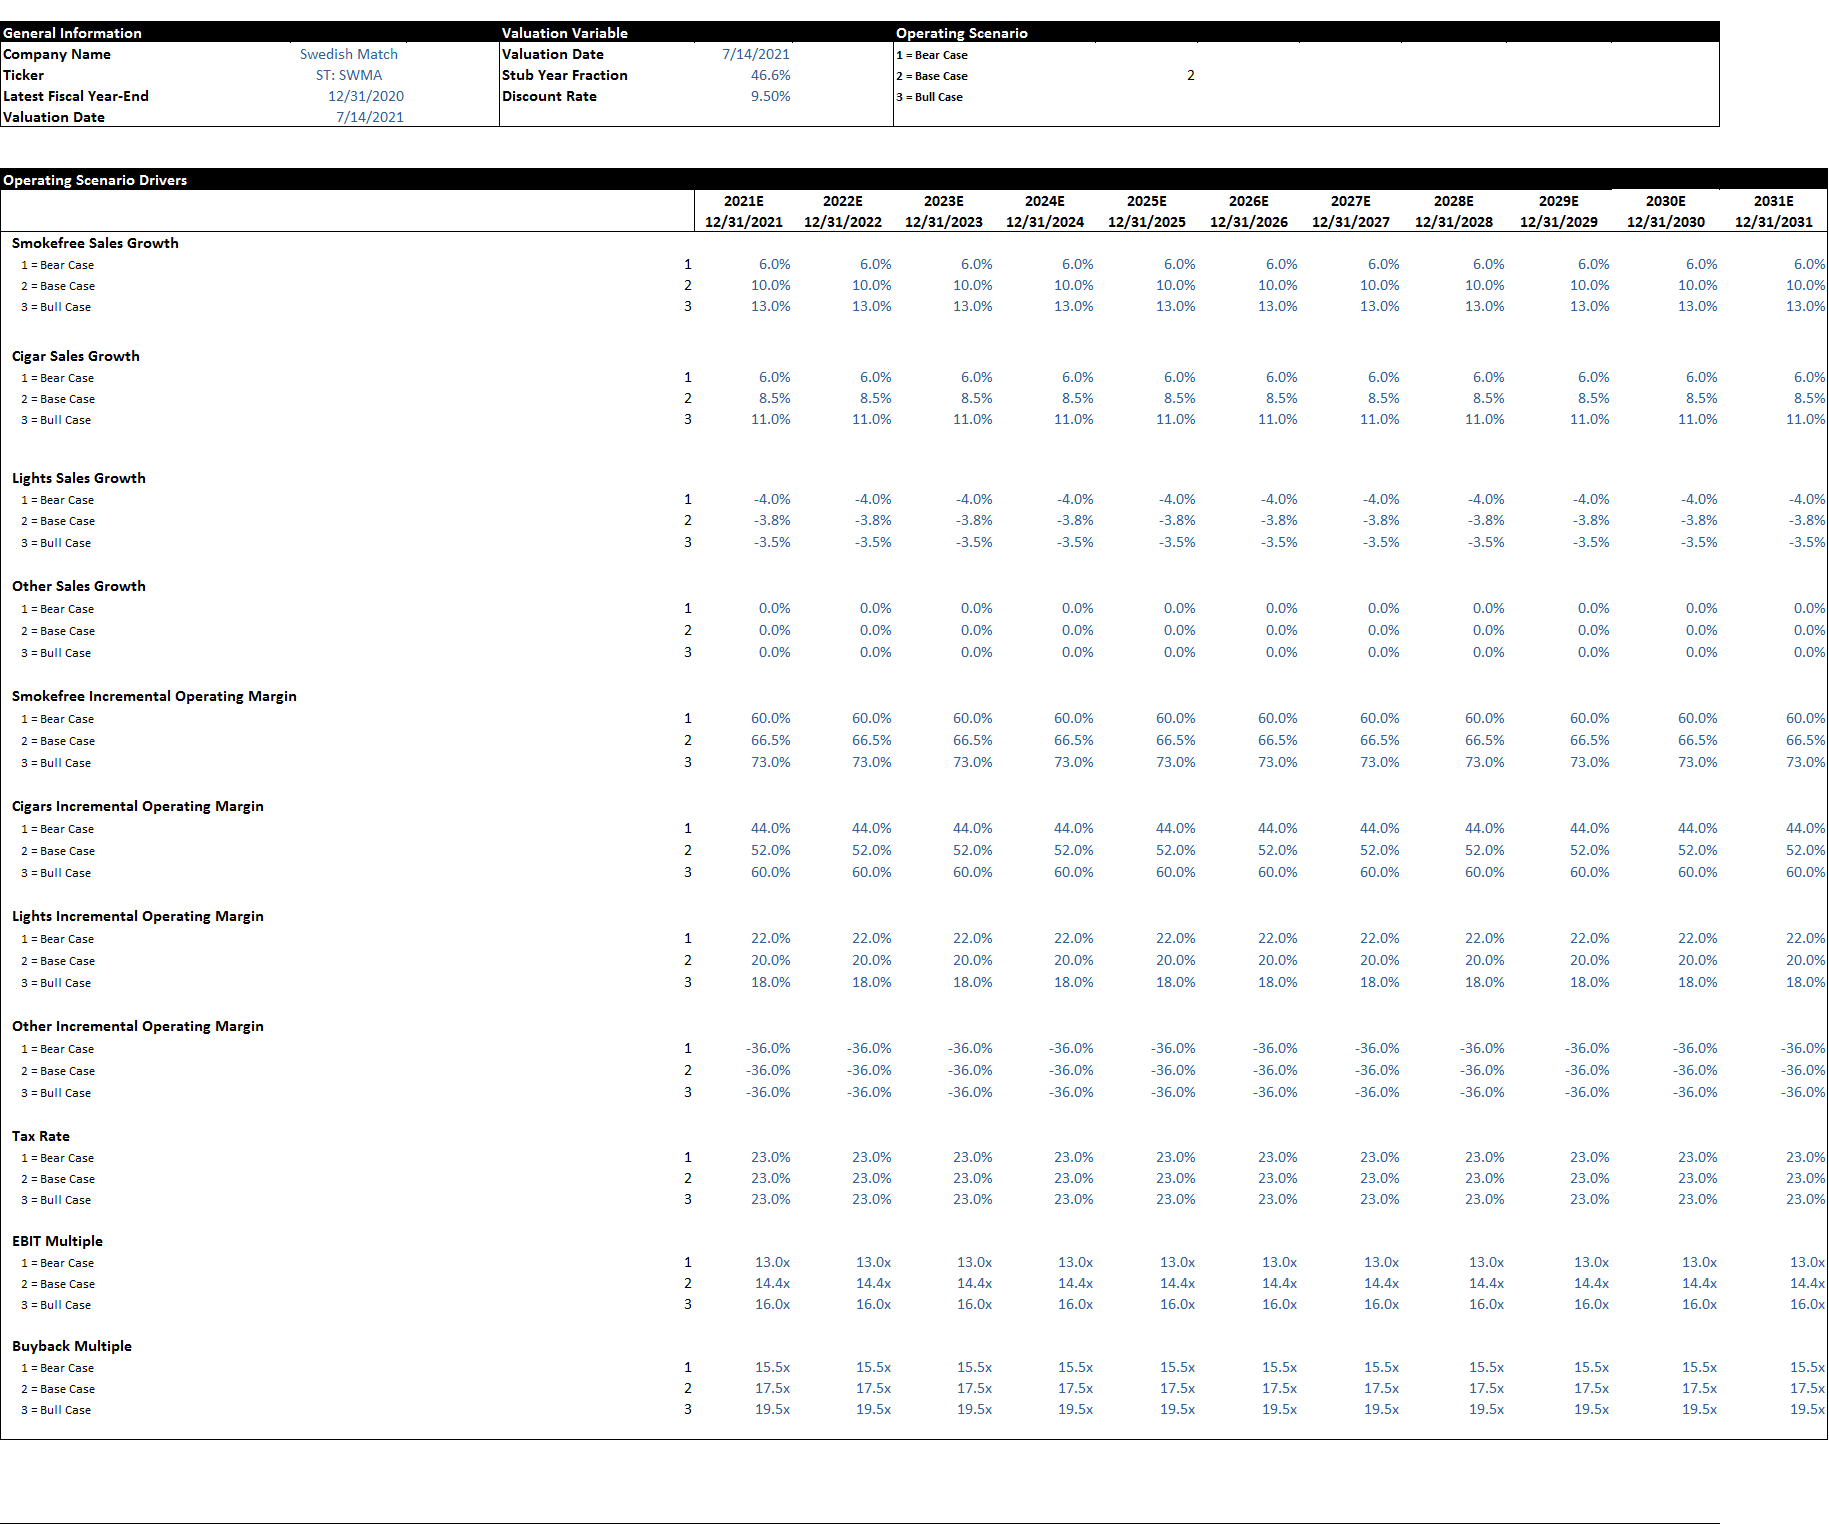
Taxes:
We’ve modeled taxes at 23%, which is in line with management guidance.
Net Leverage:
We’ve modeled Net Debt / EBIT at 2.0x, which is on the low end of management’s goal of Net Debt / EBITA of 2x to 3x
Dividends and Buybacks:
We’ve modeled a 40% payout ratio with remaining incremental cash after capital expenditures and debt repayment going towards buybacks.
Free Cash Flow Conversion:
The model yields an average free cash flow conversion ratio of 93.5%, which is lower than the actual 5-year average of 96.3% (See Appendix H).
Multiples:
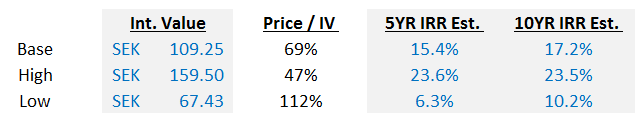
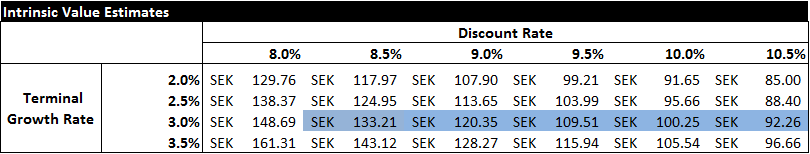
Our bear case uses a 13x EBIT Multiple, whereas the 5-year low for this figure is ~14.4x EBIT. The base case employs a 14.4x EBIT multiple, whereas the 5-year mean for this figure is ~17.4x EBIT. The bull case employs a 16x EBIT multiple, whereas the 5-year high for this figure is ~23.3x EBIT.
This section is included for those who may lack context of competition in the oral and cigars categories. Please feel free to skip this section, as all of this information is available in SWMA’s 2020 Annual Report.
Smokefree – US:
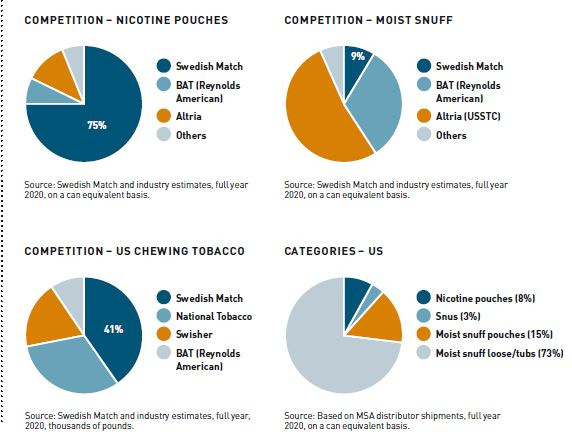
SWMA’s primary competitors in the US Oral category are Turning Point Brands (“TPB”) in Chewing Tobacco and Altria & BAT in MST/Nicotine Pouches. The Chewing Tobacco category is effectively a duopoly where ~73% of the market is controlled by the top two players: TPB (~32%) and SWMA (~41%). The market is small, shrinking, and subject to regulation which dissuades new entrants. The category is also lower margin (i.e., lower ROIC) than alternative Oral categories like MST or Nicotine Pouches which dissuades competition from the likes of Altria and BAT. As a result, there is a high degree of cooperation amongst category participants, contributing to strong pricing power.
Differently, SWMA is the third horse (~15% volume share) in the composite Nicotine Pouch + MST category. Altria and BAT effectively control ~83% of the MST category through their ownership of the Copenhagen, Grizzly, and Skoal brand names. These competitors have immense scale relative to SWMA. They can subsidize the cost of their nicotine pouches “On!” and “Velo” to end consumers by leveraging their dominant cigarette and MST franchises. With the use of deep promotions, effectively pricing their pouches at $0.99 or free, both Altria and BAT have managed to make volume gains in the category. However, the chart above from Altria’s Q1 presentation highlights that volume gains from promotional activity lack persistence. After promotions end, Zyn volume shares begin to trend towards pre-promotion levels. For this reason, we find US retail dollar share figures to be more informative (see table above for Q1 2021 ASPs). Dollar share figures underscore that SWMA is the clear leader (~70%+ dollar share) in US nicotine pouches. We believe this demonstrates some degree of consumer brand loyalty in the category and general defensibility in the nicotine pouch business that renders scale relatively less important than brand.
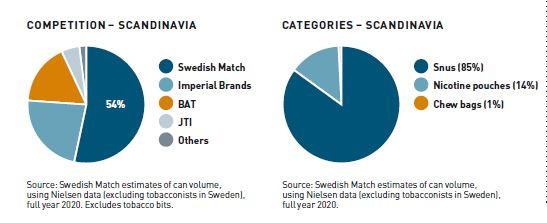
Smokefree – Scandinavia:
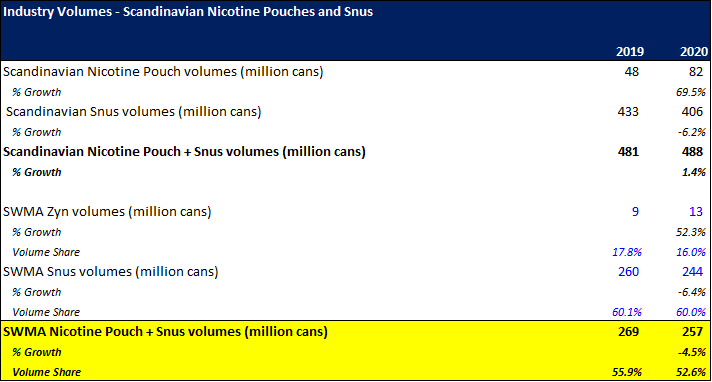
In Scandinavia, SWMA is the clear leader in the Oral category with ~54% volume share overall: ~60% volume share in Snus (#1), ~35% share of Chew bags (#2), and ~16% share in nicotine pouches (#2). Their primary competitors in the category are Imperial and BAT. Imperial is more dominant in Snus, where it is the clear #2 to SWMA. Despite the greater scale, Imperial has yet to make a sizeable dent in SWMA’s share of the Snus category. Differently, BAT is far and away the leader in Scandinavian nicotine pouches with a 60%+ volume share in the category. Assuming BAT is employing a similar strategy in Scandinavia as it is in the US, scale and lower prices seem to be of greater value competitively speaking – in Scandinavia – as its relative market share increased during 2020, while SWMA’s declined. Unfortunately, we were unable to find concrete ASP data and, as a result, cannot comment on the retail dollar share dynamics in the Scandinavian nicotine pouch category. Another interesting dynamic to observe will be to see how the growth of Nicotine Pouches affects Snus volumes. In 2020, SWMA’s overall oral volumes in Scandinavia declined ~4.5% due to a ~6.4% decline in Snus. Management highlighted this decline was the result of one-time factors associated with the pandemic. Results in Q1 2021 highlighted that this was indeed true, as SWMA’s Snus volumes increased ~8%. The company also engaged in price increases, demonstrating that pouches have not contributed to any competitive weakness in Snus. However, we still believe it will be important to monitor industry Snus volumes because, as the category leader, any meaningful changes in industry volumes will have a disproportionate impact on SWMA. Alternatively, it will also be interesting to see if SWMA can increase its share in Scandinavian nicotine pouches. The current strategy isn’t working, so the company has noted a shift in strategy: highlighting a multi-brand approach instead of focusing on the single banner, Zyn, it operates in the US.
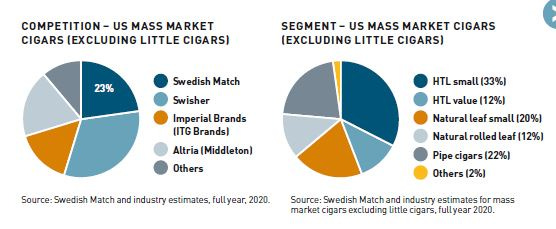
Cigars – US:
SWMA is the #2 player (~23% share) in the oligopolistic US Cigars category. If we further normalize SWMA’s volume TAM to include only the segments in which it competes, ~74% of mass-market cigars (HTL & Natural Leaf), its volume share increases to ~31%. In the cigar category, the company’s primary competitors are Swisher and Imperial. Swisher and Imperial are headlined by their Swisher Sweets and Backwoods brands, respectively. Swedish Match operates a multi-brand approach operating under various banners, the most notable of which is White Owl. Like SWMA’s Oral business, the Cigars business enjoys similar barriers to entry (scale, distribution, regulation, brand loyalty, etc.) and a cooperative industry structure. We believe the strong price increases, coupled with SWMA’s YoY volume share gains, highlight the strength of their competitive position in the broader cigars category.
Appendix H: Capital Intensity, FCF Conversion, and WC Intensity
Very insightful post. Thanks for putting it together. I'm not familiar with the nicotine industry so seeing the details on industry structure and distribution of product sales across types was super interesting.
I'm curious how you view the threat of non-traditional nicotine sales channels to the SWMA thesis. I've noticed Amazon lists competing nicotine pouch products and Zyn is nowhere to be found (https://www.amazon.com/s?k=nicotine+pouches). With MST & pouch sales still a small portion of the overall nicotine market and penetrating into new consumer buckets fast, this whitespace could be filled by rivals utilizing more convenient sales channels than a c-store. Given the stickiness of consumers to pouch brands/flavors, SWMA could lose out on the new basket of consumers buying from Amazon or other online channels. Do you view this as a material risk? But maybe the market is so large and it won't matter since SWMA is generating 233% incremental returns on capital :)
I can definitely speak to the stickiness of the products and how new non-traditional consumers are exploring the pouch products. On a tip from a friend, I recently tried a 3mg pouch and now can't stand to try any other brand/flavor. Prior to trying, I never smoked or dipped tobacco. One last thing - when I read people out there are taking 12mg pouches my jaw hit the floor. That's nuts to me.
Amazing piece! The only thing I'd like to have read more about would be an analysis of the market valuation compared to peers in addition to the chart of Jon and why a multiples rerating of SWMA is not likely.